"With an engineering degree in chemistry and materials science, my career has evolved across diverse sectors; from the chemical and marine industries to advanced manufacturing and digital transformation wit AI. After 7 years in the chemical industry, I transitioned into manufacturing systems and continuous improvement within the marine sector, where I gained deep expertise in industrial automation, data engineering, and operational excellence.
Most recently, as a Lead Data&AI Consultant (Manufacturing), I've advised large industrial companies on their Industry 4.0 digital transformation journeys helping them integrate cutting-edge technologies such as AI and quantum computing, streamline processes, and future-proof their operations. My unique skill set spans manufacturing, chemistry, computer science, sales and linguistics, enabling me to bridge technical and strategic perspectives effectively.
Over the past decade, I've also founded and scaled three successful businesses, gaining hands-on experience in entrepreneurship and leadership. I'm driven by complex challenges and always seeking the next opportunity to create meaningful impact at scale."
About: A leading Japanese multinational information and communications technology equipment and services corporation, focusing on digital transformation, AI, quantum-inspired computing, and sustainability.
Lead Industry 4.0 and digital transformation pre-sales initiatives, leveraging a portfolio spanning OT systems, digital twins, and Data & AI technologies
Engage & pitch directly with COO/CIO/CTO stakeholders to define strategic roadmaps and high-impact solutions, ensuring measurable ROI through vendor-agnostic architectures and Fujitsu IP (Kozuchi Foundry).
Advice and Deploy Advanced AI & Quantum-Inspired Tech including Knowledge Graph RAG, Causal AI, Agentic Orchestration, and the Digital Annealer (pseudo-quantum) to solve complex combinatorial manufacturing challenges.
Represent Fujitsu at sales and marketing events, promoting digitalisation capabilities and thought leadership. Coordinate cross-functional, pan-European teams and global delivery centers to execute complex programs on-site and overseas.
Project manage European-wide local teams to deliver solutions to our customers.
Key Achievements
Business Growth: Spearheaded C-level pitches securing 5 new enterprise opportunities, generating €1M+ in annual revenue with a 50%+ win rate.
Operational Impact: Accelerated project delivery by 2 months through hands-on, on-site troubleshooting; improved NPS from 4 to 9 by fostering deep customer intimacy on the factory floor.
Thought Leadership & Prospecting: Co-produced high-impact LinkedIn content and marketing videos on Data/AI, generating thousands of impressions and directly converting 3 discovery calls with Tier 1 industrial stakeholders.
Innovation Visualisation: Enhanced client buy-in by building high-fidelity mock-ups and bespoke pitch decks that simplified complex concepts and secured stakeholder buy-in from prospective clients.
Certifications & Training
Tulip MES Essentials CertifiedChallenger Sales CertifiedGoogle GenAI Certified
Sabbatical Year around South America
Apr 2023 - Oct 2024
From Peru To Colombia (via Puerto Williams)
In April 2023, I moved to Barcelona for 3 months to brush up my Spanish and started picking up Portuguese before embarking on my sabbatical journey to South America. The adventure started in Lima, Peru and continued south until Puerto Williams, Chile (the southernmost city in the world) when things literally went south. I got stranded with no way to reach Ushuaia. Instead of panicking, I went to the docks, met a Argentinian couple, and managed to hitch a ride on a sailboat across the border into Argentina. The adventure continued northwards to Brazil, where my basic portugues was enough to genuinely connect with locals and even helped me talk my way out of a few tense situations, keeping me safe and scam-free. After visiting 8 countries, this sabbatical ended in Colombia. Beyond the incredible landscapes and fauna, this journey was a masterclass in reading people and thinking on my feet. It put my language skills to the ultimate test and proved that a little genuine connection is all you need to navigate any terrain.
Sabbatical Highlights
Portuguese Learning 6-day Choquequirao trek (4650m) to Machu Picchu Easter Island Visit Amazon River Cruise in Hammocks Rio Carnaval
Manufacturing Systems & CI Engineer
Oct 2019 - April 2023
Brighton, UK
About Cox Marine
Industry: Diesel Outboard Manufacturer
Headcount: ~100 employees worldwide (in 2026)
Turnover: ~€5.4 Million (£4.6 Million Dec24)
About:A leading British manufacturer of diesel outboard engines, focusing on innovation, sustainability, and customer satisfaction with a focus on government and commercial customers
Driving digital transformation through Industry 4.0 initiatives to optimize TAKT time, enhance product quality, and reduce operational costs. Designing and deploying interoperable manufacturing systems to enable real-time data collection, advanced analytics, and data-driven decision-making across production environments.
Led integration of Operational Technology (OT) devices (nutrunners, torque wrenches, leak testers, Siemens S7 PLC systems, pick-to-light solutions) into factory networks to support smart manufacturing and automated production lines, ensuring full traceability of key manufacturing data. (open protocol, S7 protocol and others). Connection with other Enterprise systems (ERP, MES, CRM, PLM, Epicor, Visual Factory, Salesforce, TeamCenter)
Architected and implemented end-to-end data pipelines and scalable data collection strategies, enabling real-time monitoring via customizable dashboards and visualization tools. Delivered company-wide visibility of production performance and KPIs. (C#, AngularJS, MSSQL, VisualFactory)
Spearheaded continuous improvement (CI) initiatives using Six Sigma Black Belt tools, Lean Manufacturing, and World Class Manufacturing (WCM) methodologies to reduce defects, improve process capability, and increase operational efficiency. (MSA, DoE, Ishikawa diagram, Yamazumi chart, etc.)
Collaborated cross-functionally with engineering, quality, and production teams to identify process inefficiencies, resolve design issues, and implement corrective and preventive actions (CAPA).
Key Achievements
Reduced TAKT time by 50% on the main production line. Automated Transmission Shim Pick to avoid rework. Build 10+ data/AI driven tools to control, monitor and report production progress. Advocated continuous improvement mindset to production colleagues.
Certifications & Training
Diesel Outboard BuildData/AI Essentials Training
Sabbatical Year around Asia
Oct 2018 - Oct 2019
From Sri Lanka To Japan
In 2018, I took a deliberate leap into the unknown, embarking on a 7-month, 16-country backpacking expedition from Colombo to Tokyo. By throwing out the fully-planned itinerary and letting local voices guide my path day-by-day, I experienced nearly 100 cities in their rawest form. That adventure fundamentally rewired me. It taught me how to thrive in the organised chaos of India, negotiate & bargain all the time in Thailand, connect across any cultural divide in China, and view the world through a vastly broader lens like in Japan. Now, I’m bringing that same adaptability, humility, and fierce motivation back to the industry.
Industry: Plaster, Plasterboard & system solutions Manufacturer
Headcount: ~1300 BG employees in the UK, 162,000 globally at Saint-Gobain (in 2026)
Turnover: €46.5B (in FY2025 for Saint-Gobain)
About: British Gypsum, part of the Saint-Gobain group, is the UK’s leading manufacturer of interior lining systems. With over 100 years’ experience in plaster, plasterboard and ceiling solutions, British gypsum already have a multitude of high-performance products and systems and continue to innovate for its customers providing comfort, protect against fire and insulate against sound.
Led cross-functional projects to develop and industrialize innovative plasterboard solutions, combining project leadership, Six Sigma Black Belt methodologies, and Lean Manufacturing principles to translate legal/customer requirements into scalable, high-quality products & building systems.
Directed end-to-end project delivery using DMAIC frameworks, partnering with marketing, procurement, R&D, and operations to transform project needs into robust solutions through QFD (Quality Function Deployment) and Advanced TRIZ methodologies.
Collaborated with UK manufacturing plants to launch new products and optimise processes, applying Kaizen and Lean Manufacturing tools to improve efficiency, reduce waste, and resolve quality issues during validation production trials.
Monitored and analysed Factory Process Control (FPC) data, leveraging Measurement System Analysis (MSA) and statistical tools to ensure process capability and maintain product quality within specifications.
Designed and executed Design of Experiments (DoE) and product validation plans to assess performance, support data-driven decision-making, and ensure compliance with technical and customer standards.
Established and standardized health, safety, and operational procedures, conducting risk assessments and ensuring compliance with COSHH and SafeOps requirements, reinforcing a strong safety culture across operations.
Key Achievements
Successfully led 10+ UK-based projects related to synthetic desulphurised gypsum (DSG) to natural product conversion. Certified Six-Sigma Black belt.
Certifications & Training
Six-Sigma Black Belt CertifiedProject Leadership CertifiedTRIZ Innovation Methodology TrainingHealth, Safety & Environment Training
Project Leader
Jan 2013 - Oct 2014
Cambridge, UK
About The Welding Institute
Industry: Materials Joining and Engineering Consultancy
Headcount: ~800 employees globally
Turnover: €81M (£69.2M in FY2024)
About: The Welding Institute (TWI) is a global leader in materials joining and engineering consultancy, providing research, training, and technical services to industries worldwide. TWI specializes in welding, joining, and materials technology, supporting innovation and industrial development across sectors such as aerospace, automotive, energy, and manufacturing.
Led client-funded and EU collaborative R&D projects within a membership-based organization specializing in materials science and advanced joining technologies, delivering innovative solutions across metals, ceramics, glass, and polymers.
Developed advanced joining and material processing solutions (sintering, soldering/brazing, diffusion bonding), enabling reliable interfaces between similar and dissimilar materials.
Authored and submitted European FP7 proposals (Stage 1 & Stage 2), including technical work packages, consortium coordination, and cost modeling, contributing to successful multi-partner projects.
Led technical proposal development and business development for private clients and EU programs, combining engineering expertise with commercial strategy.
Collaborated with international partners, research institutes, and industry stakeholders to build competitive consortia aligned with EU funding criteria.
Delivered end-to-end client proposals, including technical scoping, site visits, solution design, and budget definition, translating customer needs into tailored R&D solutions.
Conducted site assessments and stakeholder workshops to capture requirements, assess feasibility, and strengthen client relationships.
Key Achievements
Led and worked on 3 multi-millions multi-year GBP EU FP7 framework projects such as:
MEMLAB: Developed next-generation lead-acid battery components through materials engineering and process optimisation.
RenewX: Designed compact, multi-source heat exchangers for renewable energy applications.
Soleglass: Engineered high-efficiency solar thermal collectors using advanced glass-to-metal joining.
Delivered 2 customer projects (£100k+).
Intern Student Year 5
Feb 2012 - Sep 2012
Brussels, Belgium
About Solvay
Industry: Chemical Manufacturer
Headcount:~8400 employees globally
Turnover: €4.3B (in FY2025)
About: Solvay is a global leader in materials science and engineering, providing innovative solutions for various industries. The company specializes in the development and production of advanced materials, including polymers, composites, and specialty chemicals.
Engineer in chemistry specialised in material science (MSc)
Sep 2009 - Oct 2012
ENSCL, Lille, France
Theoretical knowledge and laboratory experience in metallurgy, chemical engineering and in polymer and ceramics science. Familiarisation with conventional characterisation and testing techniques (XRD, SEM, XFM, AFM, SFX, mechanical testing, etc.)
Intensive courses in chemistry, physics, and mathematics (BSc)
Sep 2007 - Jun 2009
Lycée Lavoisier, Mulhouse, France
Intensive courses in chemistry, physics and mathematics as pre-requisites to prepare for the competitive entrance examinations to French chemistry engineering schools (“Grandes Écoles”)
General and industrial processes chemistry (A-Levels)
Sep 2005 - Jun 2007
Lycée Louis Vincent, Metz, France
Baccalauréat with the highest honours (equivalents to A-levels in Chemistry, Physics, Mathematics)
Awards
Fourth place at the National contest of chemistry - 2007
Contest organised in two stages: Only the best chemistry major from each high school was invited to take part of the contest. The first stage consisted of a 6-hour examination (non-stop) with three different topics, general, organic and industrial process chemistry. The 12 best students were shortlisted to take part of stage 2. Stage 2 is an experimental 6 h examination in the laboratory. Only the 6 best students were ranked at end of the contest.
Seventh place at the National Olympiads of Chemistry - 2007
Similarly, this contest is organised in different stages. I ranked seventh at the regional level.
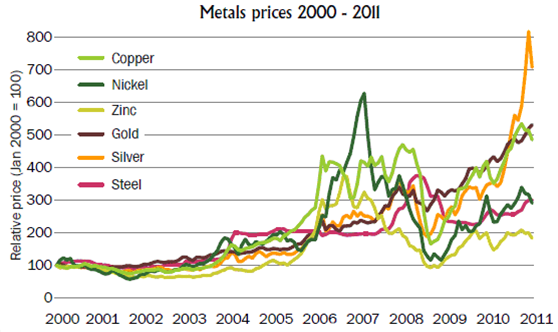
Corrosion is a recurring issue causing serious damages to various infrastructures in chemical plants and public facilities . The cost of corrosion worldwide is estimated to around 2.2 trillion US dollars, which can also be pictured as 5 tons of steel disappearing each second in the world. In addition, the evolution of the cost of metals (Figure 1) compels firms to invest in corrosion protective measures to keep maintenance costs low. The oil and gas industry is particularly affected, due to the corrosive nature of the chemicals transported via pipelines. The depletion of easily-accessible fossil fuels pushes this industry to dig deeper into the sea bed, where oil is significantly more corrosive due to its higher sulphur content. As a result, pipes used for oil extraction suffer from a short service life.
Figure 1: Evolution of the prices of various metals used in anti-corrosion applications
Opportunities
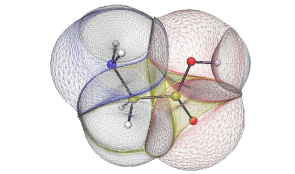
Nanotechnologies are considered as a major driver towards the next industrial revolution. The recent breakthrough in graphene production appealed industrials to massively invest in new technologies that were previously deemed to costly. Graphene is known for its exceptional electrical conductivity and mechanical properties, but also for its permeability to chemicals (Figure 2). Solvay as world-leader in fluorinated polymers decided to invest in the development of fluorinated-graphene nanocomposites to satisfy a broad range of customers encountering various corrosion issues.
Figure 2: Graphene is an atomic-scale honeycomb lattice made of carbon atoms
Objectives
The objectives were to reduce the permeability by at least a factor 2 compared to the matrix polymer (without graphene) while keeping similar mechanical properties. To reach these challenging objectives, three routes to graphene were explored for a given polymer matrix.
My Contributions
Investigated different routes to produce graphene nanocomposites
Designed experiments to determine the impact of the key formulation and process parameters
Characterised a variety of samples using DLS, DMTA, DSC and SEM/TEM
Compiled and interpreted the results to move towards optimised conditions
Further developed a cost-effective route to produce graphene/graphene oxide materials
Documented the results obtained in a report
How it's made
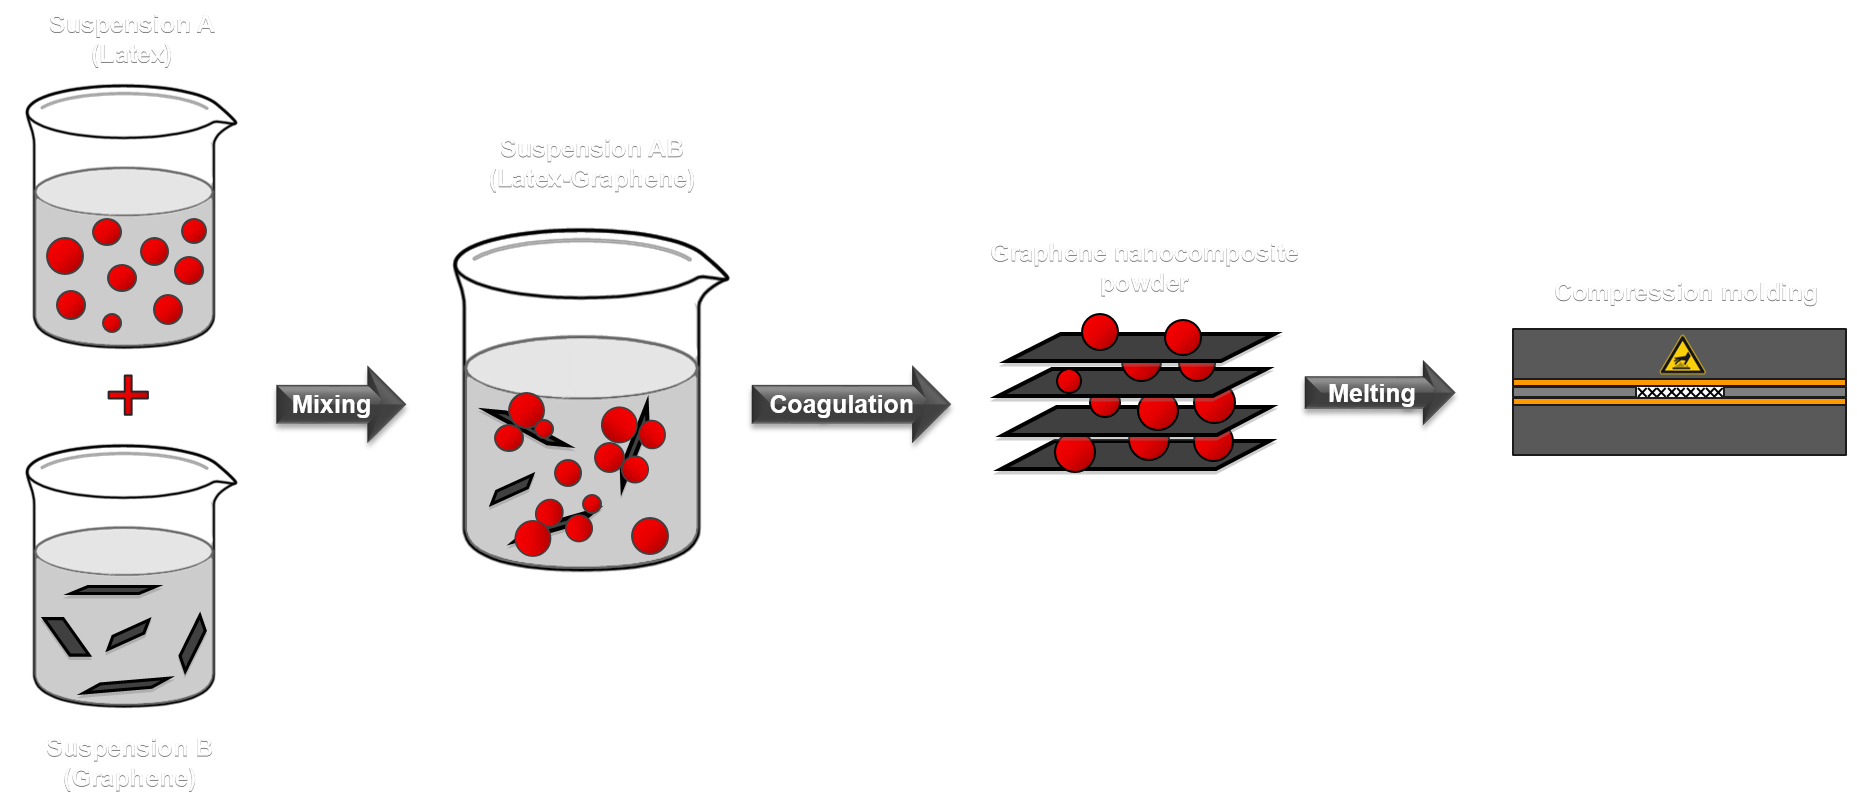
Figure 3: Production process for graphene nanocomposites
Step 1
Suspension (A) consisted of a latex of fluorinated polymers manufactured in-house with good barrier properties compared to common polymers. To prevent a premature coagulation of suspension (A) surfactants are used. Suspension (B) consisted of a suspension of graphene sheets in water. In this project the water-based graphene suspension were produced via three distinct procedures
Step 2
Suspension (A) and Suspension (B) were added and mixed together to form a so-called suspension (AB) where the latex spheres covers the graphene sheets, the surfactant present in the latex prevent the coagulation of suspension (AB)
Step 3
Suspension (AB) was coagulated using acid or inorganic salts, the coagulum was separated from the water and thoroughly washed to remove any coagulating agent or surfactant remaining. The coagulum was the graphene nanocomposite powder
Step 4
The nanocomposite powder was then dried following a precise drying procedure and then placed in a mould to be compression moulded.
*Note: The details related to this procedure have been based on the information available in Patent WO2013127712 A1. This research was funded by Solvay S.A. as part of my final year internship at the ENSCL.
Elaboration of gold nanowires via dielectrophoresis for biosensor applications
Materials involved: Gold nanoparticles in suspension, gold printed circuit
Technologies involved: Spin-coating, lithography, chemical vapour deposition (CVD), dielectrophoresis
Analytical techniques: SEM, impedance spectroscopy, optical microscopy
Technology has undoubtedly changed every aspect of our lives, especially over the last two hundred years where people have been continuously tinkering, designing, and exploring in an attempt to unlock the mysteries and complexities of the human body. Over time, machines began to play a larger role in medicine, as innovators developed new and better ways to diagnose malfunction such as diabetes and epidemiological disease like swine flu. The lack of reliable and accurate devices to detect early diseases or harmful molecules in body fluids results in delays to administrate the right treatment to patients.
Opportunities
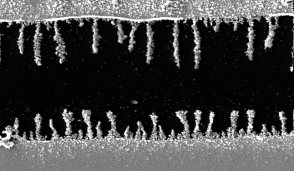
Nanotechnology is a very promising solution to produce a device capable of detecting, identifying, and quantifying biological substances in body fluids at very low concentration. Biologists, chemists and physicists, all together are keen to find solutions to make the life of suffering patients better and more comfortable. Nano-biosensors are one potential solution to this problem. The first step toward a bio-sensor is the growth of the nanowires: the backbone (Figure 1). Metallic nanowires can be obtained through diverse routes, like chemical vapour deposition, nanolithography and dielectrophoresis (DEP). Therefore, dielectrophoresis is one method that enables to grow nanowires in vivo. However, the reproducibility of the process is poor and requires further developments.
Figure 1: Gold nanowires grown via dielectrophoresis
Objectives
The main objective was to improve the reproducibility of the growth of gold nanowires via dielectrophoresis exploring the effect of the viscosity. Afterwards, the study has been extended to the electrical frequency and voltage, and the temperature of the medium.
My Contributions
Reported and suggested different ideas to improve the reproducibility of the growth of nanowires
Produce gold printed circuit from scratch starting from a microscope cover-slip. The process involved spin-coating, baking, photolithography, developing and CVD technologies
Designed experiments to determine the impact of the key formulation and process parameters
Characterised a variety of gold nanoparticle suspensions via impedance spectroscopy. Examined nanowire geometries via SEM
Compiled, interpreted and reported the results
How it's made
Figure 2: Production process for gold nanowires
Step 1
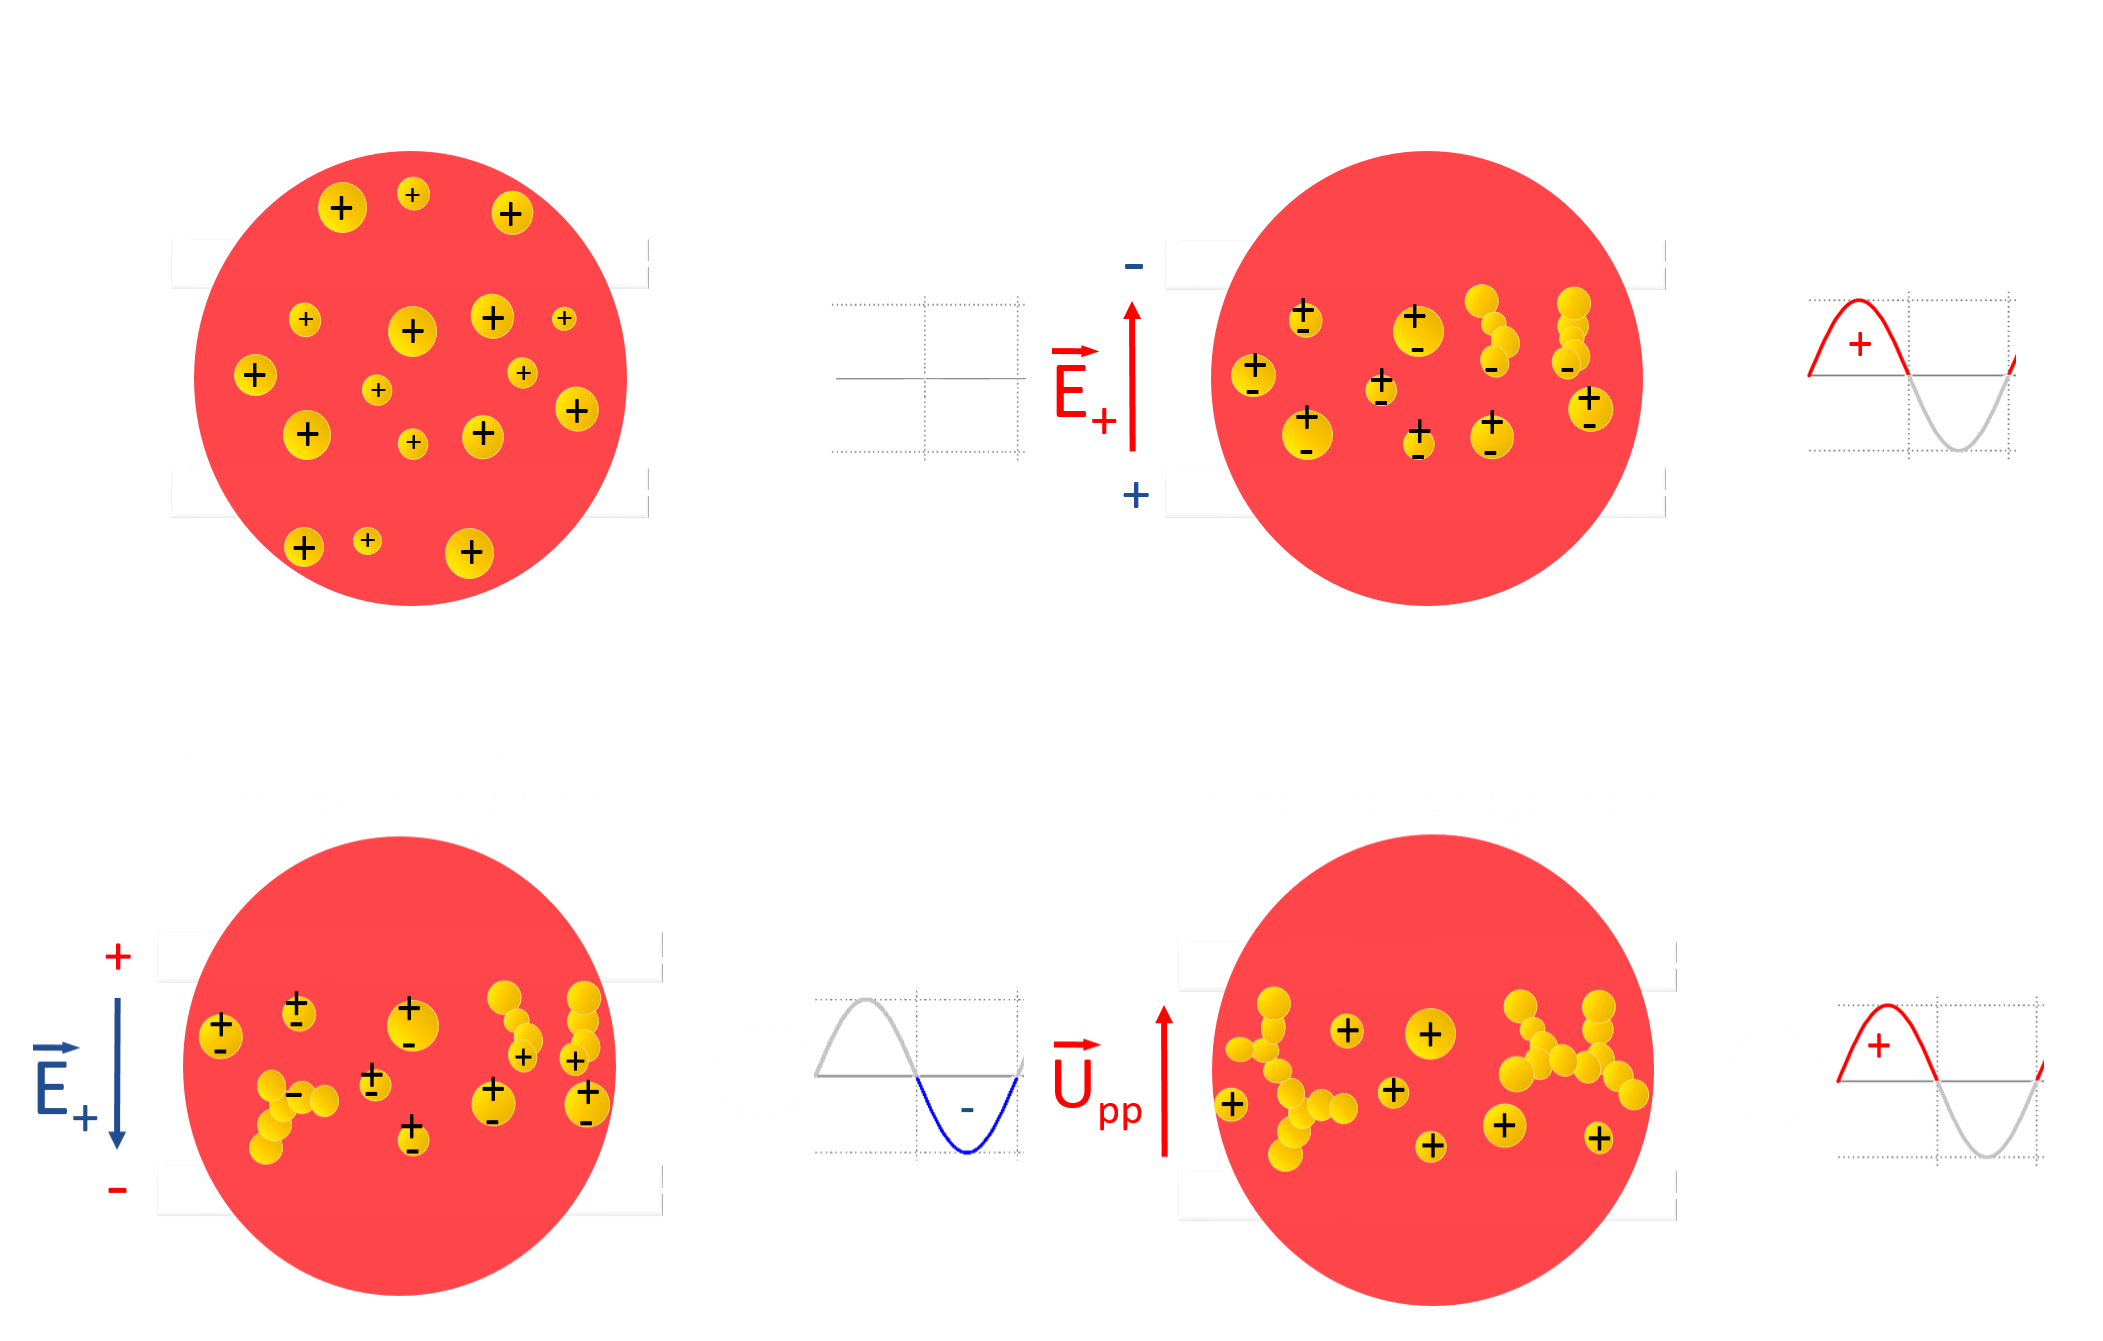
A drop from a gold nanoparticles suspension (pink colour) was placed on the gold micro-electrodes. The gold particles were suspended in water and stabilised with tannic acid and a tri-ester potassium citrate giving a positive net charge to the gold particles (in yellow). The different process parameters were set. This includes the frequency, the peak-to-peak voltage, the temperature. The temperature was controlled with a Peltier element. Suspensions with different viscosity were tested.
Step 2
When the circuit is closed, a difference of potential between the two electrodes is created. In presence of an electric field the Au-NP is polarised and because its dielectric constant is lower than the one of water (medium), a positive net force oriented in the direction of the electric field is created. This force is called the dielectrophoretic force. Particles are aligned along the field lines and joined. The nanowire has started to grow.
Step 3
When the voltage alternate from positive to negative, the electric field orientation is switched over and so it the dielectrophoretic force. The wires grow on the other side of the electrode. Nanowires already grown are now part of the electrode and modify the field lines by creating a point of convergence where the field is more intense
Step 4
After multiple voltage inversions, nanowires were grown. After a certain time, a nanowire bridged the gap between the electrodes resulting in a short circuit and in sudden increase of the peak-to-peak voltage. At this point the trial was stopped.
Disclaimer: This research was funded by T.U Dresden as part of my fourth year intership in 2011.
Melt-spun and sintered Metal fibre networks for Lead-Acid Battery (MEMLAB)
Materials involved: Titanium and aluminium fibres, lead and others low-melting point metals
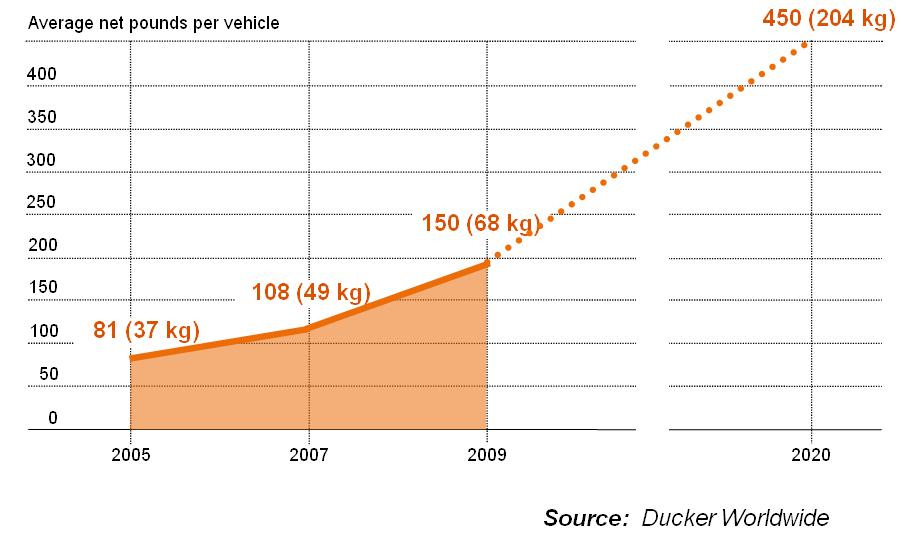
The automotive industry is constantly making efforts to improve existing technology in order to manufacture more robust, more reliable and more energy-efficient cars. One major area of improvement is the reduction of the overall weight of the car (Figure 1), this would result saving energy, minimising brake and tyres wear, last but not least, lower CO2 emissions and improved fuel consumption. To put things into perspective, eliminating 2-3 kg from the 40 million automotive transmissions manufactured that same year would save up to 125 million litres of petrol or 1.7 million barrels of crude. Apart from the engine, transmission or carrosserie, weight can also be cut down in current lead acid batteries by substituting a part of the lead with lightweight materials, this is even more significant for electric vehicle where the weight of the batteries can reach more than 100kg.
Figure 1: Average weight reduction per vehicle over the years and projection for 2020
Opportunities
The MEMLAB battery is targetted for the electric vehicle market where conventional lead-acid batteries are suitable due to their excessive weight and low energy-density. This major drawback can addressed by substituting heavy lead alloy, used for the die cast grid and plate battery electrodes, with alternative lightweight and porous electrode materials. The material developed in the project is based on state-of-the-art fibre production technology to create metal fibre networks (MFNs). The major challenges of the project lie in:
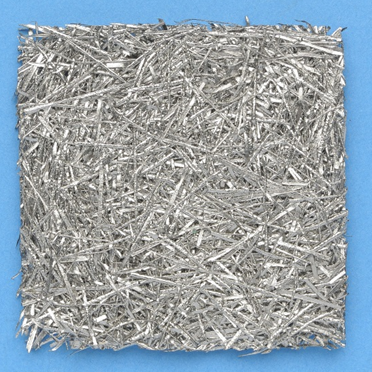
The development of a process to produce robust titanium or aluminium MFNs (Figure 2) with a large surface area and enhanced porosity
Establishing a procedure to protect MFNs with a corrosion resistant layer and also supply the active material needed to undergo repeated charge-discharge cycles
Figure 2: Example of titanium metal fibre network
Objectives
The main project objectives are to achieve a 50% reduction in the battery weight and achieve 1000 charge-discharge cyles via the development of corrosion resistant and active lead coating.
My Contributions
Identified the ideal parameters for the production of sintered MFNs in relation with their mechanical properties
Establish procedures to deposit lead onto titanium based on sol-gel and electroplating techniques
Design a new electrical circuit (connectors) to fit the novel electrode structure (MFN)
Explore joining techniques to affix the MFNs to electrical circuit
Characterise mechanically the MFN (tensile and flexural test, hardness), Optical and electronic microscopy
Assisted the CAD designer to produce design drawings for jigging and battery parts
Liaise with the partners to report and receive updates to/from the partners
Prepared 2 extended abstracts and 2 posters for the LABAT conference 2014 held in Albena, Bulgaria
Taken part of the biannual project meeting held at the different partners sites
How it's made
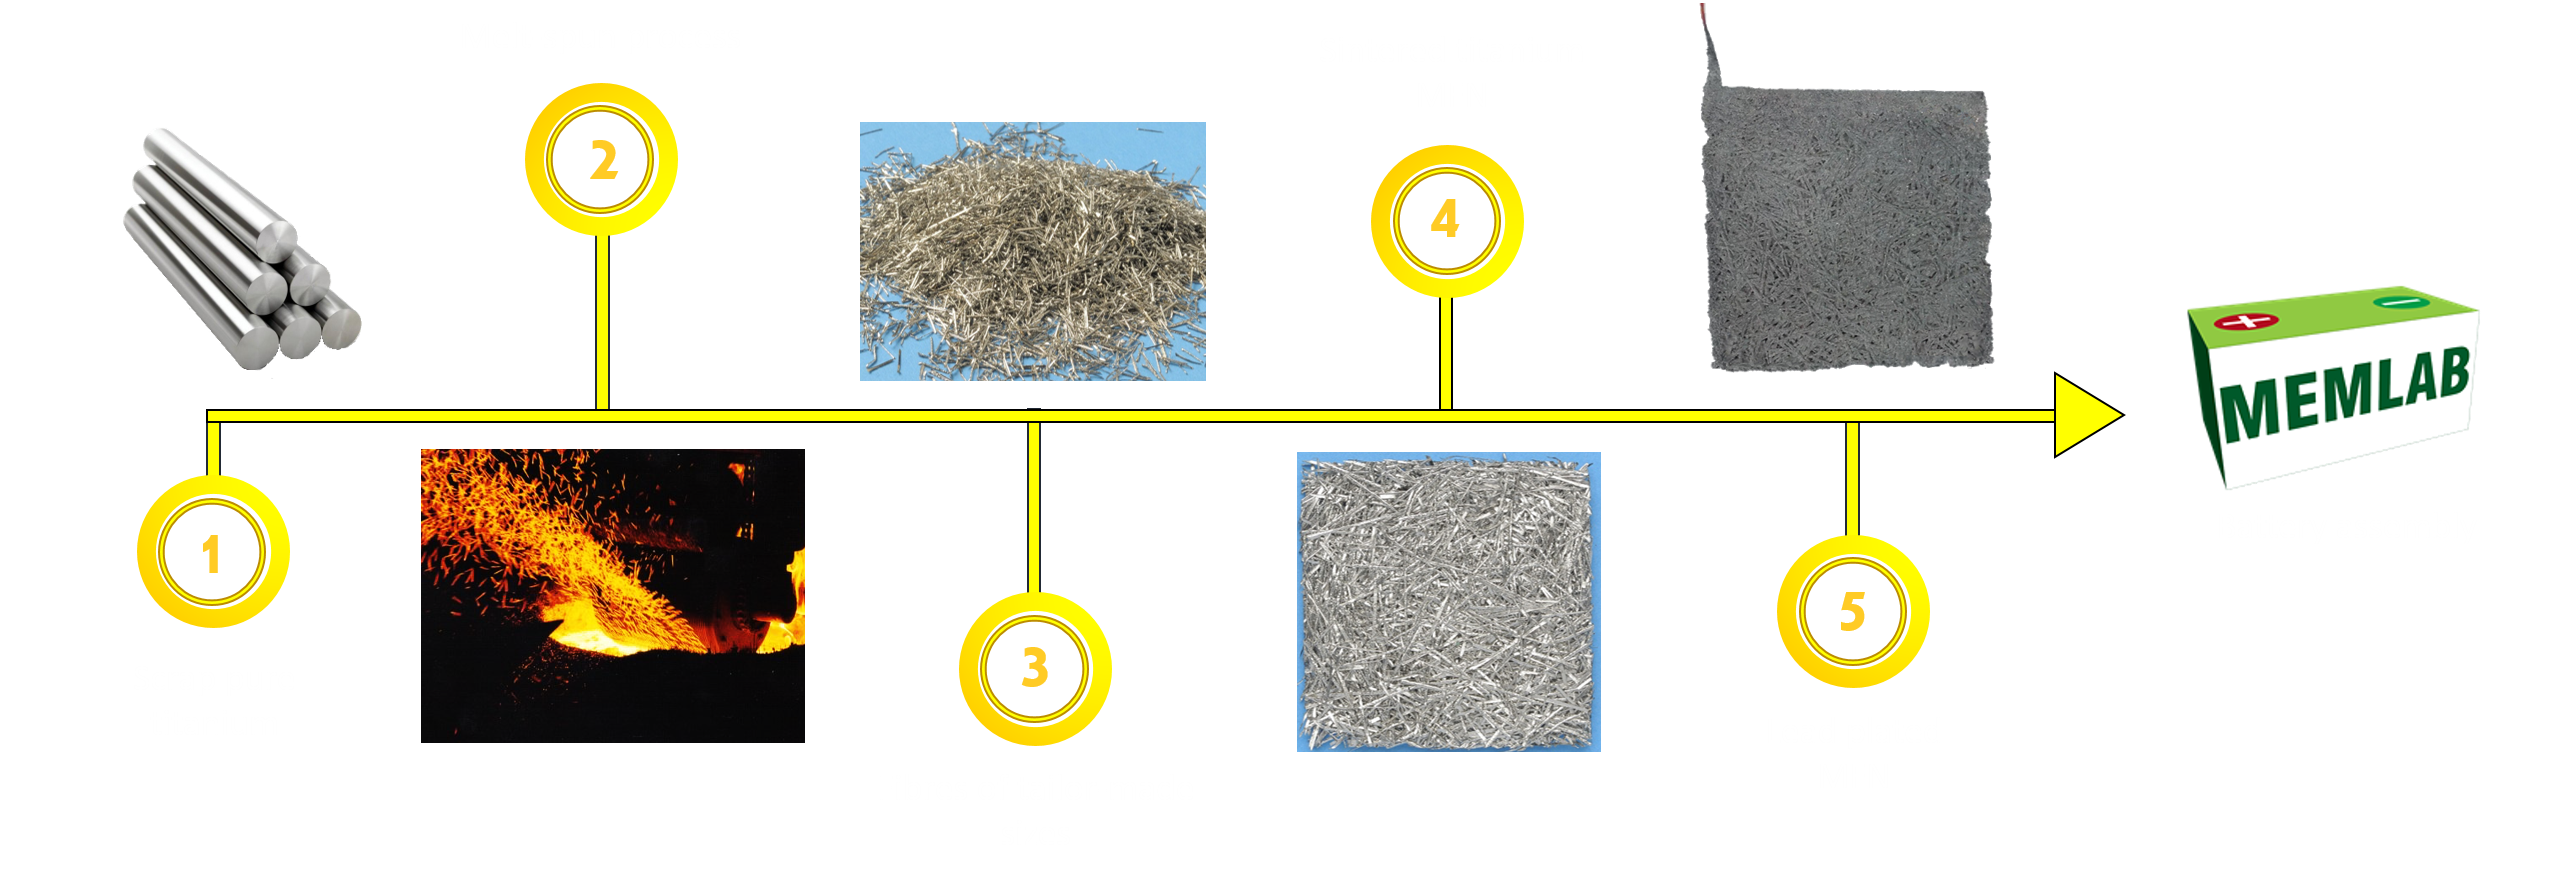
Figure 3: Production process for Titanium MFNs
Step 1
Scrap pure titanium (Gr. 1) was sourced from the aerospace or oil & gas industries as base material to manufacture the MEMLAB electrodes.
Step 2&3
The metal is melted with a plasma torch, and then a spinning and cooled profiled copper wheel is used to solidify and extract lengths of uniform metal fibres from the molten metal
Step 4
The fibres are randomly arrange to form a square (final dimension of the electrode). The fibres are placed in a vacuum furnace and run up at high temperature for few hours. The fibres are bonded via the sintering process.
Step 5
The sintered MFN then underwent successive treatment steps in order to deposit a lead layer that will provide the active material needed for the battery to work while protecting the titanium substrate. Two deposition processes were investigated electroplating and sol-gel. The electrodes are then assembled to form the MEMLAB lead acid battery
Disclaimer: The information gathered in this page were gathered the posters presented at the LABAT'2014 conference in Albena, Bulgaria
All glass mid temperature direct flow thermal solar vacuum tube (Soleglass)
Overall goals of Sustainable Energy Europe, the body appointed by European commission is to decrease the EU dependence on foreign energy sources and transform Europe into a low-carbon economy so to increase its energy security. The future landscape of European energy demands and supply will have to make much greater use of new renewable energy sources and focus more upon energy-efficient methods to achieve the European 20/20/20 goals. As heat accounts for 49% of the overall European Union final energy demand, the renewable heating sector will have to make a major contribution in order to reach the renewable energy target (Potential of Solar Thermal in Europe, ESTIF – European Solar Thermal Industry Federation). Compared with other forms of renewable energy, solar heating contribution in meeting global energy demand is, besides the traditional renewable energy like bio mass and hydropower, second only to wind power, and has a much larger contribution than photovoltaic.
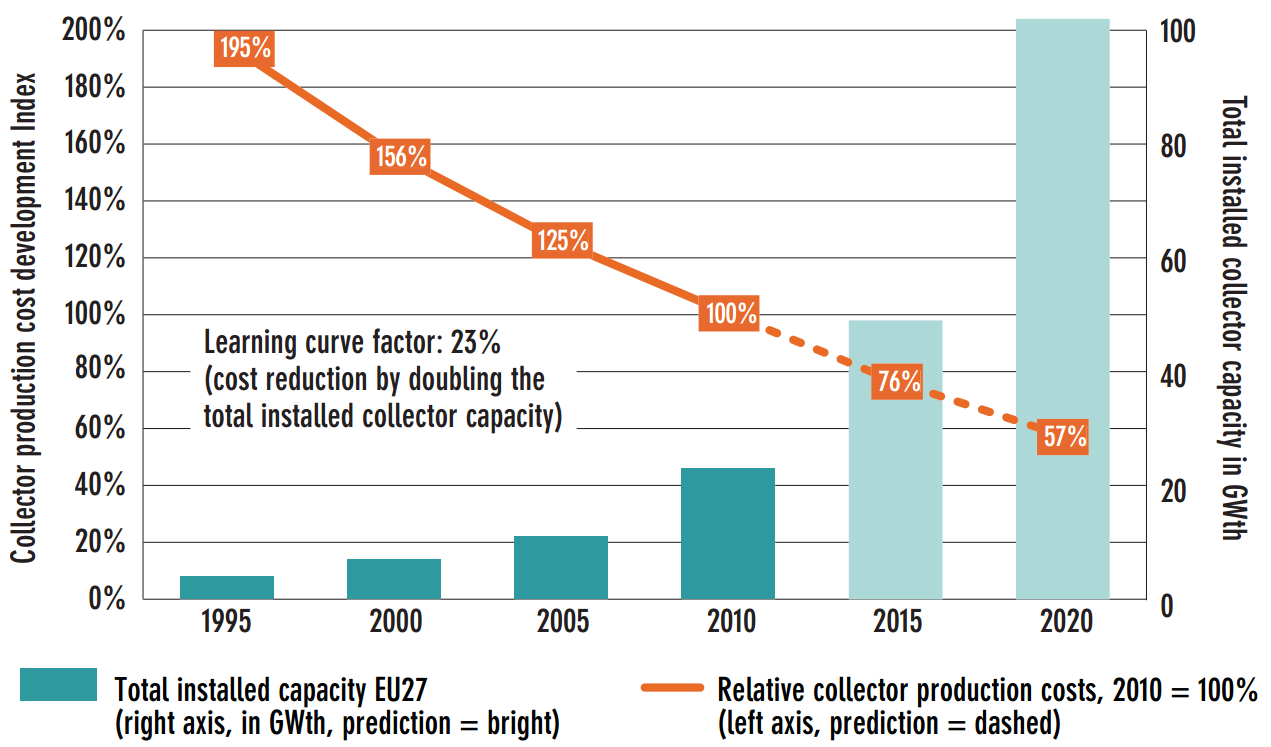
Figure 1: Evolution of the installed capaciy of solar collector compared to expected reduction in cost of fabrication at horizon 2020
Opportunities
Thermal solar is a rapidly growing global market at all levels, indifferently whether it is related to the application field or temperature levels. The mid temperature range in Thermal Solar applications, from 100°C up to 300°C, is one with the highest market potential. Solar thermal heat generation in mid temperature range is combinable with a whole series of power generation, industrial and home applications as:
Industry processes heat
Solar Cooling and Heating, residential and service
Solar power plants
However, the implementation of the solar thermal technologies in the mid temperature application range today is limited, because of lack of reliable products and relatively expensive technologysolutions, primarily:
solar tubes
collectors and/or concentrators
One of the major existing products limitation is complex vacuum retention technology for mid/high temperature range and subsequently the high product cost and also the glass-to-metal seal
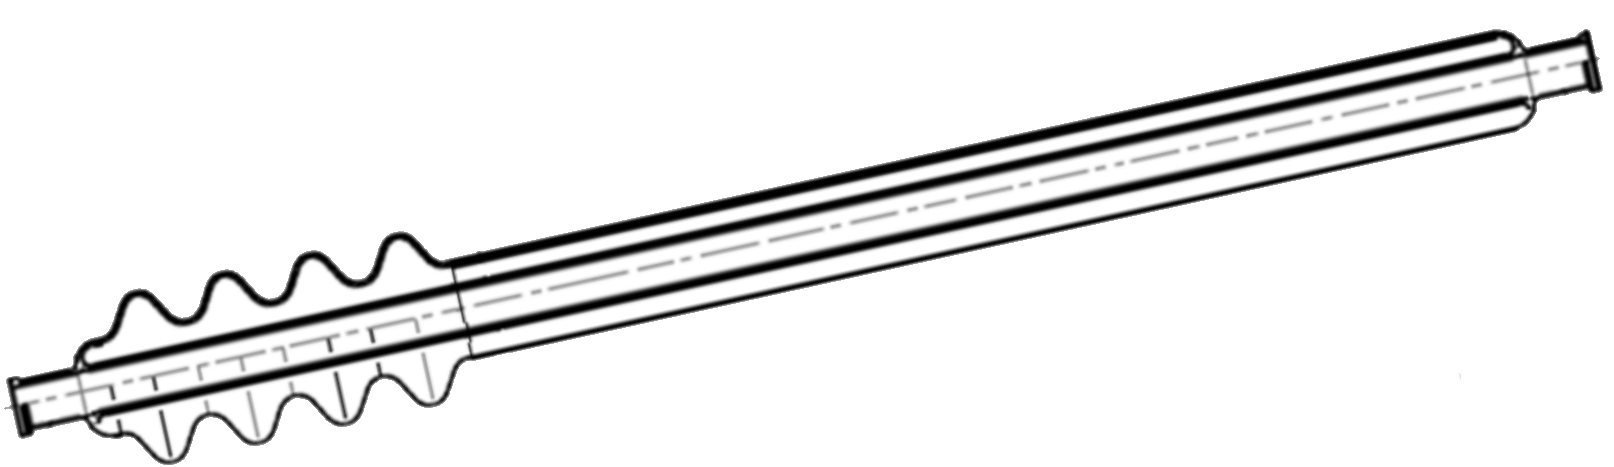
Figure 2: Design drawing of the Soleglass collector tube
Objectives
The aim of the project is to construct a vacuum tube utilizing and combining the best features and advantages of both systems described previously, suitable for medium temperature range.
supply the heat in the temperature range 100-300°C
ensure the reliable vacuum retention and ensure tube efficiency
decrease initial material cost for the solar tube production
abate tube assembly costs
Taking in account all reasons mentioned in project objectives All Glass Tube will be developed in two variants:
1) SOLEGLASS-L for lower medium temperature range (100-160°C) to be applied with related CPC (Compound Parabolic Concentrator) collector
2) SOLEGLASS-H for higher medium temperature range (160-300°C) to be applied with related CSP (Concentrated Solar Power) collector
My Contributions
Identified the state-of-the-art of compact heat exchangers
Established a standard test specification procedure to test heat exchangers
Assisted with the manufacture and the metallography of the heat exchanger
Attended the Heat exchanger action group (HEXAG) and process intensification network (PIN) meetings in Newcastle, UK in 2013 and 2014
Liaise with the partners to report and receive updates to/from the partners
Taken part of the biannual project meeting held at the different partners sites
There are over 200 million households in Europe whose combined domestic heating needs account for around 30% of Europe's energy demand. Reducing this will be essential if Europe is to achieve ambitious emission reduction targets (i.e. 2020 targets) and decrease our excessive reliance on imported energy. The clear solution to these two problems is to increase the amount of renewable energy used, an ambition at the heart of much recent EU legislation, of which new Heat Pump systems are a key enabling technology
Opportunities
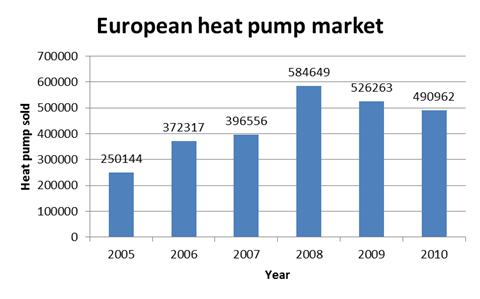
Despite the recent success of the European heat pump industry there are still several major challenges to overcome and opportunities that need to be exploited. (Figure 1). Despite significant incremental technological progress (i.e. compressor technology, refrigerants, valves), heat pumps still command a price premium compared to modern condensing boilers. If no subsidies are available, this means that a heat pump (when competing directly with gas) must significantly outperform gas based alternatives, which is difficult as the gas price typically ranges at 1/3 of the price of electricity per kWh. Furthermore, compared to ground source heat pumps, little changes have been made to the conventional finned tube heat exchangers used in air source heat pumps. The latter have much wider applicability on a European scale. The main project objectives are as follows:
Increase efficiency and smaller footprint of the evaporator (compact heat exchanger design)
Ability to utilize secondary or event tertiary energy sources to complement the air side
Increase the Seasonal Performance Factors (SPF) which will improve the return on investment for consumers and hence attractiveness of EU air based heat pump systems
Figure 1: Evolution of the heat pump market in recent years
Objectives
RenewX project aims at developing and demonstrating a novel and competitive heat exchanger technology platform enabling the integration of secondary or tertiary energy sources and manufacturing processes that will enable increased market penetration of European-made heat pump systems.
My Contributions
Identified the state-of-the-art of compact heat exchangers
Established a standard test specification procedure to test heat exchangers
Assisted with the manufacture and the metallography of the heat exchanger
Attended the Heat exchanger action group (HEXAG) and process intensification network (PIN) meetings in Newcastle, UK in 2013 and 2014
Liaise with the partners to report and receive updates to/from the partners
Taken part of the biannual project meeting held at the different partners sites
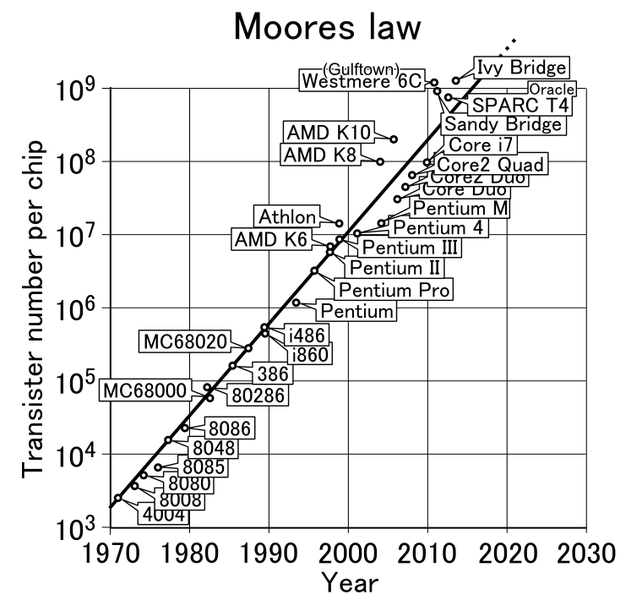
The rise of computers in 1950 and the exponential growth of computer processing power (Moore's law - Figure 1.) have unlock new possibilities for scientist to run the most complex and time consuming mathematical algorithms to predict and understand complex and sophisticated chemical processes. The progress of technology has open a new door to a new type of science, computational quantum chemistry where the prediction of phenomenon become possible
Opportunities
Computer predictions offer an opportunity to biologists and chemists to comprehend the reactivity of large and multifunctional molecules such as protein-ligand interactions in the human body with the objective to develop new drugs. The development of mathematical models to predict the activity of drugs on certain proteins offers insight where laboratory experiment is ambiguous, impossible, hazardous, time-consuming or just too costly.
Figure 1: Evolution of the transistor number per chip over the years - Moore's law
Objectives
To establish a reliable and accurate force field (mathematical equation) for the prediction of the ab-initio energy of amino-acids or proteins
My Contributions
written several file manipulation scripts in Perl
coded scripts to generate new amino-acids conformers based on the rotation of the dihedral axis
developed a code to compute the atomic local frame of atom in molecules
rewrite code to compute the normal mode frequencies
generate distorted structures to feed in the krigin model for the machine learning (prediction)
Disclaimer: This research was funded by Manchester university as part of my third year internship in 2010 at the ENSCL
Turbo Annonces - Automation software to list classified ads (France)
Age at Launch: 21 years-old
Programming language: VB6
Years active: 2011-2014
Status: Self-employed (France)
Addressable market: Online shop owners
Origination
As a student, I used to undertake occasional jobs to make some pocket money, such as private tuitions or providing outcall computer troubleshooting services. My services were mostly promoted through a classified ad website called Leboncoin. One day, I received a request from an online shop owner who needed help with listing thousands of products on the Leboncoin platform. Unfortunately, at that time, there was no API available to automate the process or upload the listings in bulk. Therefore, the only option was to manually transfer the details and images of each listing from the online shop's website to the Leboncoin platform, which could take around 2-3 minutes per ad. Automating the process seemed like the most logical solution.
Opportunity
It was evident that the current process of manual listing creation was not only time-consuming but also prone to errors, making it an inefficient method. In light of this, it became imperative to develop a software solution to speed up the task. The original gig involved publishing 1300 listings at a rate of 0.25 euros per listing, which would take approximately 65 hours to complete manually. Hence, it made practical sense to create a prototype software that could automate the process, thereby reducing the time and effort required. Additionally, the developed software could be marketed to other online shop owners seeking to enhance productivity and visibility while minimizing costs associated with manual labour.
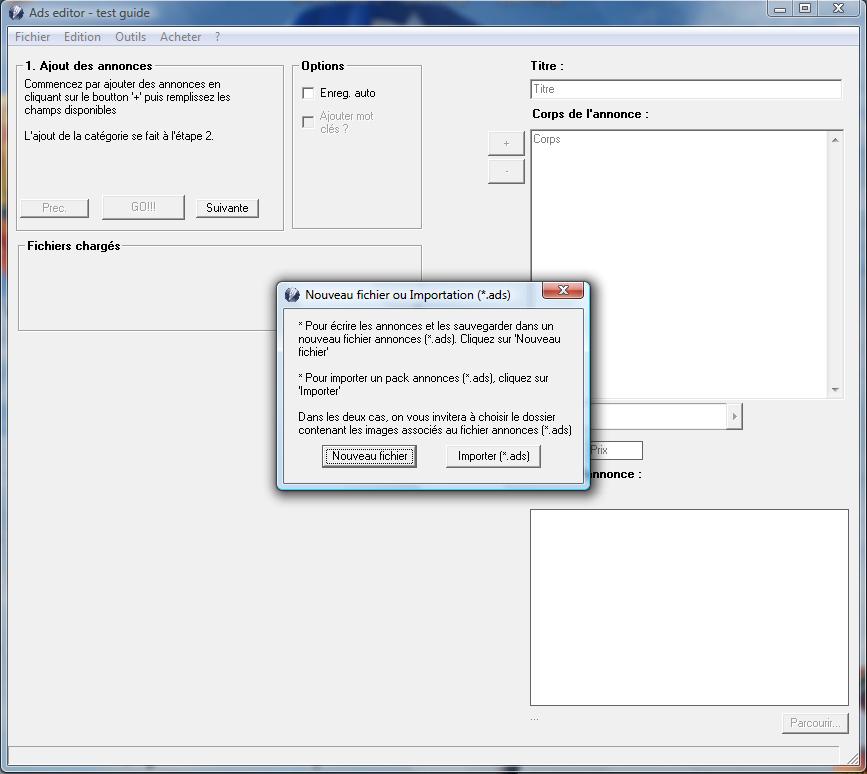
Screenshot 1: General user interface of the ad editor
The Software
The initial application mainly focused on automatically posting listings to the Leboncoin website. As development shifted to commercialisation, the application became a suite of applications with 4 distinct applets
1. The spider crawler - It was a bespoke application that crawled the online shop listings and packaged the data into a listing file (*.ads)
2. The listing editor - This applet would allow the customer to edit listing data, for example predict the item category from the description, edit the price, title and linked associated images
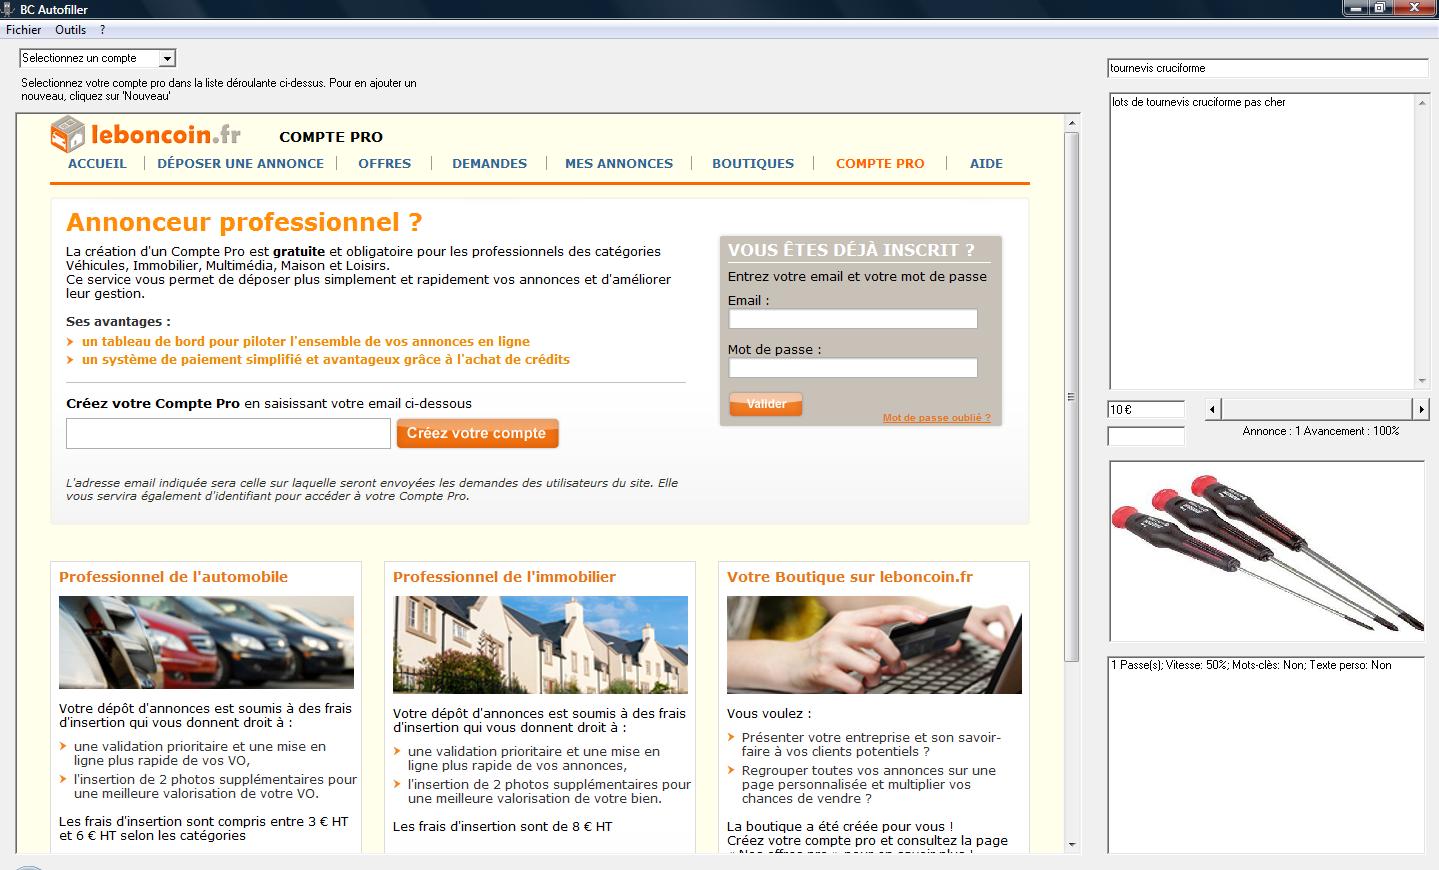
3. The Poster - This applet would simply automate the listing process to LeBonCoin.
4. rePoster - This application would resubmit automatically listing that failed the approval process. LeBoinCoin usually rejected duplicate or close duplicate listings. In most cases, repeatedly submitting the listing through brute force would eventually result in its approval. The software achieved this by extracting the resubmission link from the customer emails, which were accessed through Outlook or Windows Mail.
Screenshot 2: The Poster's general user interface
Key developments
Develop Turbo Annonces' website
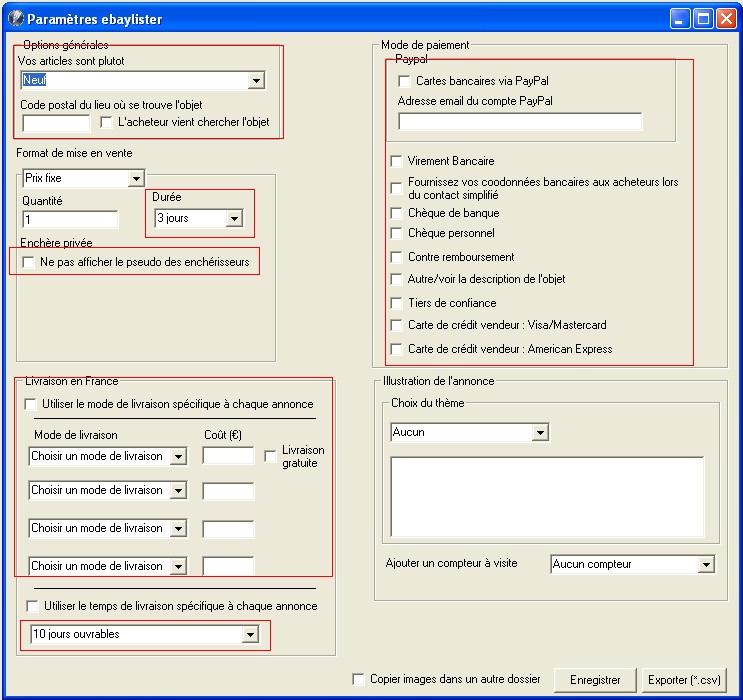
Update the suite to create/manage Ebay Stores and upload listings
Screenshot 3: Ebay Lister's general user interface
Downfall
The initial setback that the suite encountered was the alteration in the Leboncoin platform's policy. Initially, the platform had no limitations on the number of listings per account. However, this changed later on, and individual accounts were limited to 5-10 listings, while professional accounts could list more items but were required to pay a fixed fee based on the item type (ranging from 3-8 euros). This resulted in a significant reduction in the suite's total addressable market and value-for-money in general. Furthermore, Leboncoin enhanced its approval process, resulting in a significant number of listings being rejected. To mitigate bot activity, they also introduced a captcha feature.
Initially, the approach was to discontinue support for the Leboncoin platform and instead focus on expanding support for eBay Stores. I initiated this strategy, but after six months of intensive work, I realized that catching up with the competition would require significant resources, and I was unable to dedicate the necessary time to this project at that time. As a result, in 2014, I decided to relinquish my self-employed status and can the project.
Lessons Learnt
VB6 was not the adequate programming language to develop such far-reaching project as it is too archaic for scalability and to mine data. (VB6 was the only language I could program in at the time.)
Developing a software that plugs into a 3rd-party website is accepting to be at the mercy of policy changes which can render a software completely useless.
As my first try at commercialising a software suite, I understood that error logging/management was paramount, the importance of UX/UI in software design and beta testing.
Citylife Nottingham Ltd. - Events and Trips for international students (UK)
Age at Launch: 25 years-old
Years active: 2016-2019
Status: Limited company
Addressable market:International and Erasmus students
During my first year in Nottingham, UK, I was eager to socialise and make new friends. To this end, I attended a Bar crawl event, where I met Seb and Simon, who were organising the event. It was one of their first events, and after discussing for a while, I proposed that we join forces since I had prior experience running events, mainly during my time in Cambridge. Initially, my role was to act as a representative, selling bar crawl tickets, as the business expanded to include additional events like Meet&Speak's and trips. In January 2016, Citylife Nottingham Ltd. was officially established, and by June 2016, I became one of the acting CEOs. At its peak, Citylife Nottingham was running four weekly events and international trips such as an 8-day long Morocco trip and a Euro Trip.
Opportunity
The opportunity was clear, competition was quasi-inexistent for international student events in a city with more 110k students (15k were non-UK). Our direct competitor 'Viva la fiesta' was running for a number of years but had low customer satisfaction due to poor execution. The business quickly gained market share forcing Viva la fiesta to fold in Nottingham. Citylife Nottingham expanded to Leeds and Manchester in the following years
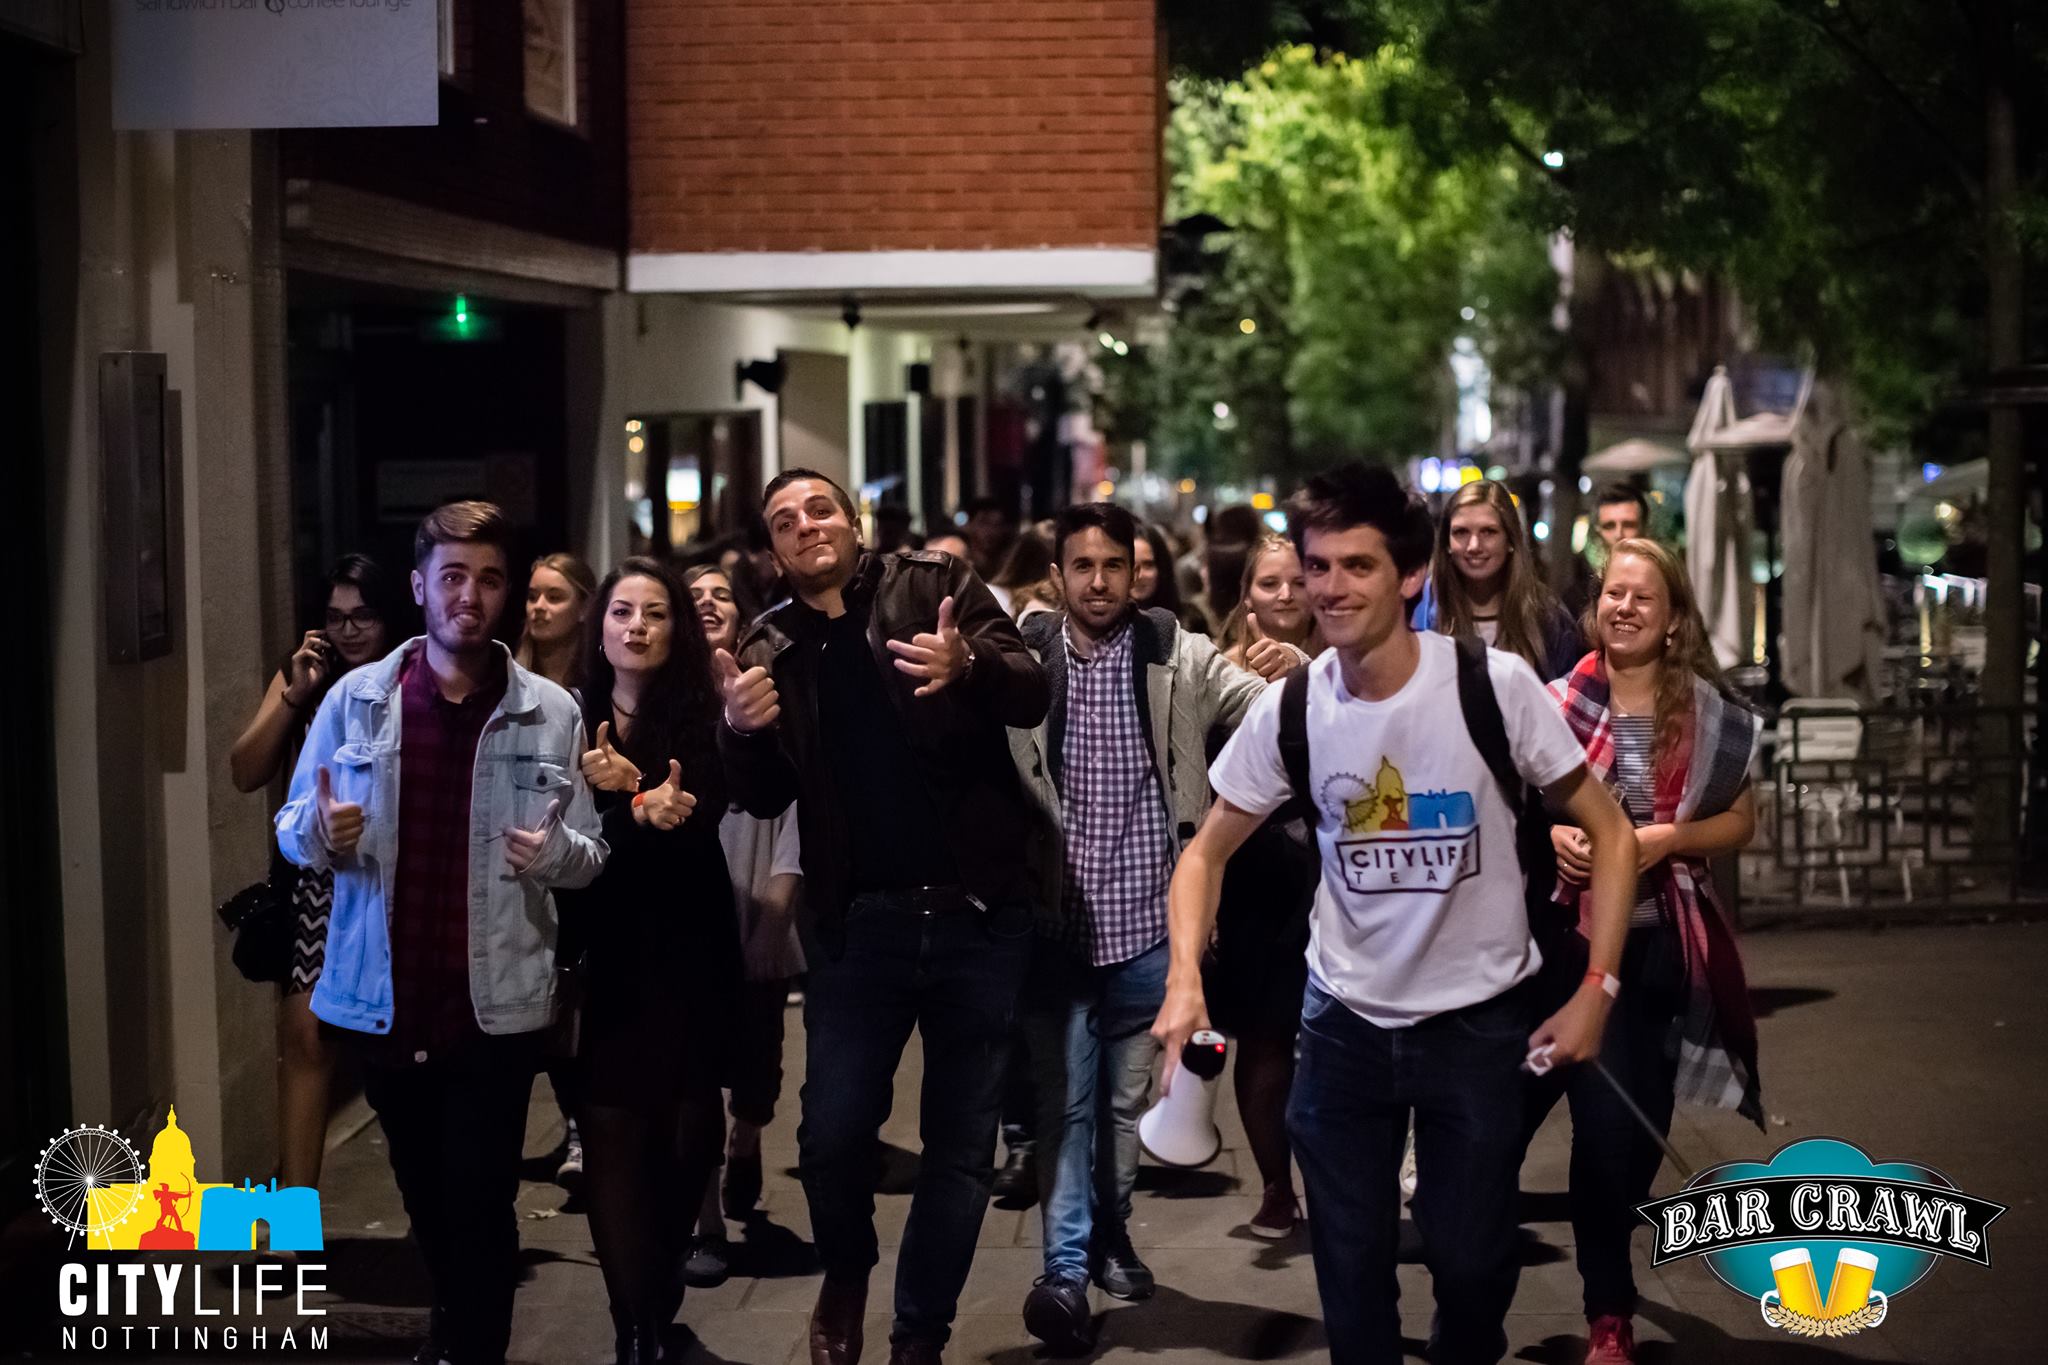
Leading one of the first 2016 Bar Crawl Event
Our offer
Parties which included bar crawl and private parties for international students
Free events such a Meet&Speak (Themed Social event with free food). Meet&Dance, Meet&Bowl, Meet&Laser. All Meet&Something were 100% free for Citylife card holders
UK trips: Coach trips round the UK to destinations including Bath&Stonehenge, Oxford, Cambridge, York, Edinburgh, Conwy&Snowdonia, Peak District, Liverpool, Lake District and Brighton.
International trips: Euro trip from Paris to Amsterdam via Brussels and Bruges, Morocco round trip and Ibiza weekender
General help to assist International students settle in the UK
Facebook cover for Citylife's Meet&Speak event - French Edition
My main contributions
As an acting co-CEO, I had the opportunity to overview the broad business operations from preparing trips, to launching events and developing technical tools to run our marketing strategy
The Citylife card: was a loyalty card offering our members 15% discount to all our events, exclusive discounts at local restaurants, bars and nightclubs, and free access to chargeable events for non-members. The card was sold £10 for a semester, £15 for 2 semesters. I led that project from start to end. It ranged from building partnerships with local businesses, designing and printing the card to setting up our ticketing platform.
The entertainer: My role at the events was to bring everyone together and making sure our customers were having a blast. I had the chance to lead a 400-strong crowd of festive and inebriated students at bar crawls and a 7-day long trip around Europe.
The programmer: Once more, my programming skills were put to good use to automate some tedious tasks. Most of our marketing was pushed on Facebook via groups and ads. The initial strategy was to create custom Facebook accounts and randomly add international students as friends. We could easily reach the maximum limit of 5000 friends. Subsequently each marketing profile would add people to 'International Student'-themed Facebook groups. Creating a script to add people in bulk was not excessively challenging and saved a lot of time.
The event creator: We constantly had to imagine new event concepts to attract a different crowd and expand our reach. We organised a few treasure hunts round the city, or a pre-bar crawl event sponsored by Taco Bell. Meet&Speak Specials focused on one country and its traditional food.
Facebook cover for Citylife's 8-day Morocco trip
Downfall
The main issue with this type of business was scale. There were very little opportunities for economies of scale. The second issue was the over reliance on Facebook for advertising and the fact that most international students only stay 1 or max 2 semesters. This meant that marketing efforts had to constantly be renewed with no options to capitalise on previous effort.
In June 2018, I decided to step down from my position of co-CEO as I ambitioned to focus on something different and more scalable. In 2020, the Covid-19 pandemic happened and Citylife had to pause all its operations. To this date, it is unclear if Citylife UK will resume its operations.
Lessons Learnt
It is a good start to have profitable business but potential avenues for scaling is crucial
The business had 3 acting CEOs which does not always facilitate decision making
My Party Bible - Nightclub and bar directory and local nightlife event aggregator (UK)
As I as backpacking tour around Asia in 2018-19, I realised that finding bars or nightclubs in a city I never set the foot in appeared to be more challenging than I thought. Not to forget the large scale of Asian metropolis. Solutions to address the aforementioned challenge where not perfect at the time, a quick google would not always help as key information would be missing for example entrance fee, drinks prices, music genres or even the dress code. Other questions quickly arised, do I need an ID and which kind? On my return to Europe, I thought it would be a nice project to focus on to remedy all these aleas. I wrote the first lines of code for My Party Bible in June 2019.
Opportunity
Initially, the first opportunity I saw, was a gap in the market. In 2020 I could not find many websites that would compete for that niche and focus on nightclub and bar data, that is also one of the reason I picked that project versus another. As development progressed and users started to discover My Party Bible, monetisation opportunities started to emmerge such as displaying ads, use paid affiliate links, business accounts, commision revenue from ticketing platform or even sale of pre-booked VIP treatment, to name a few. A alternative opportunity I saw was a personal one, at that time I already had in mind to move away from chemical engineering and R&D and shift to data engineering/process improvement in general. I thought that investing some of my time on this project would be a great opportunity to further advance my web development skills but also showcase them in a real-life product.
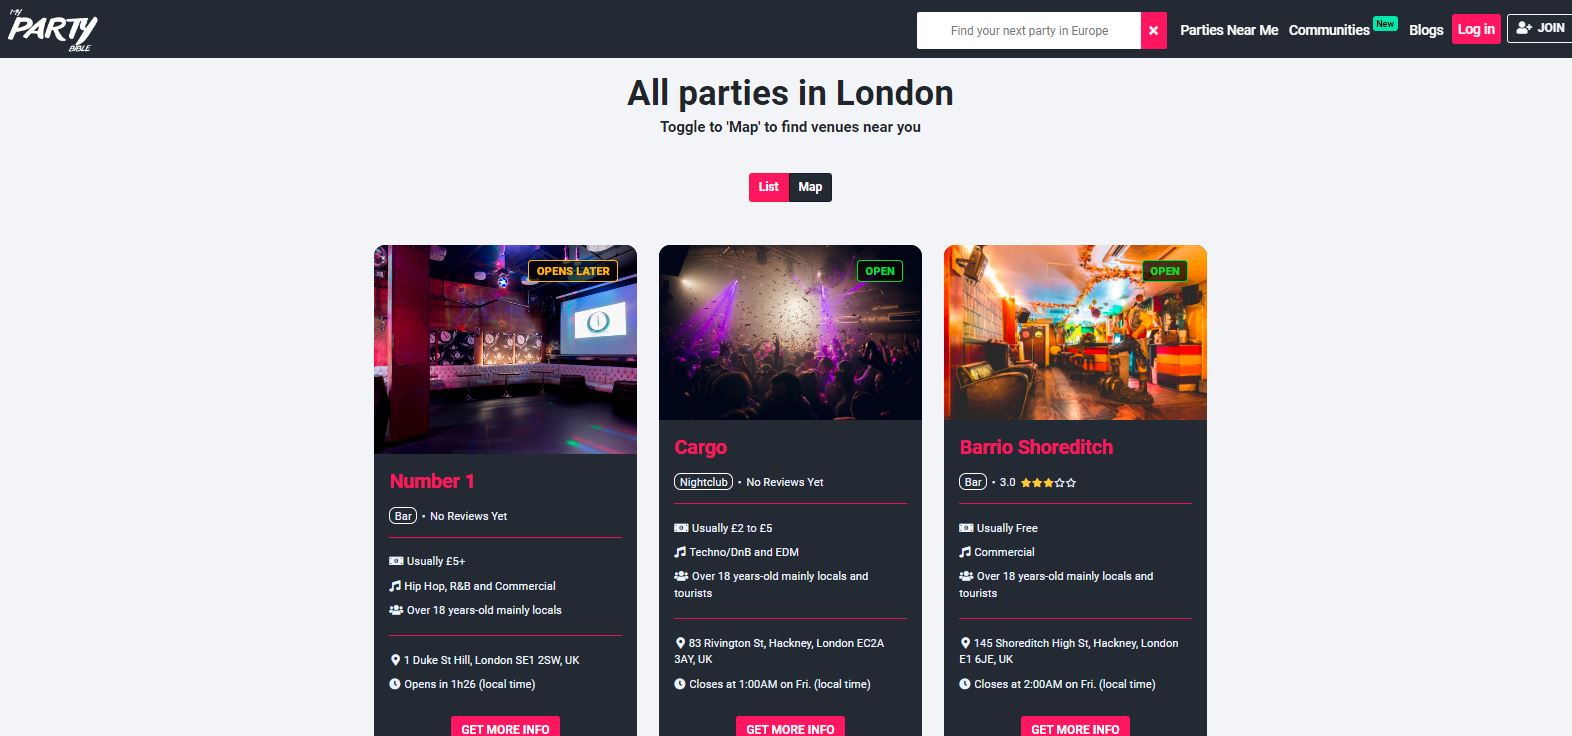
Screenshot 1: General user interface of My Party Bible search list
The development
In the initial phase of the project, I focused on developing a piece of software to mine the nightclub and bar data from the internet, I then developed the web app in various phase (customer side, admin side and business dashboard side)
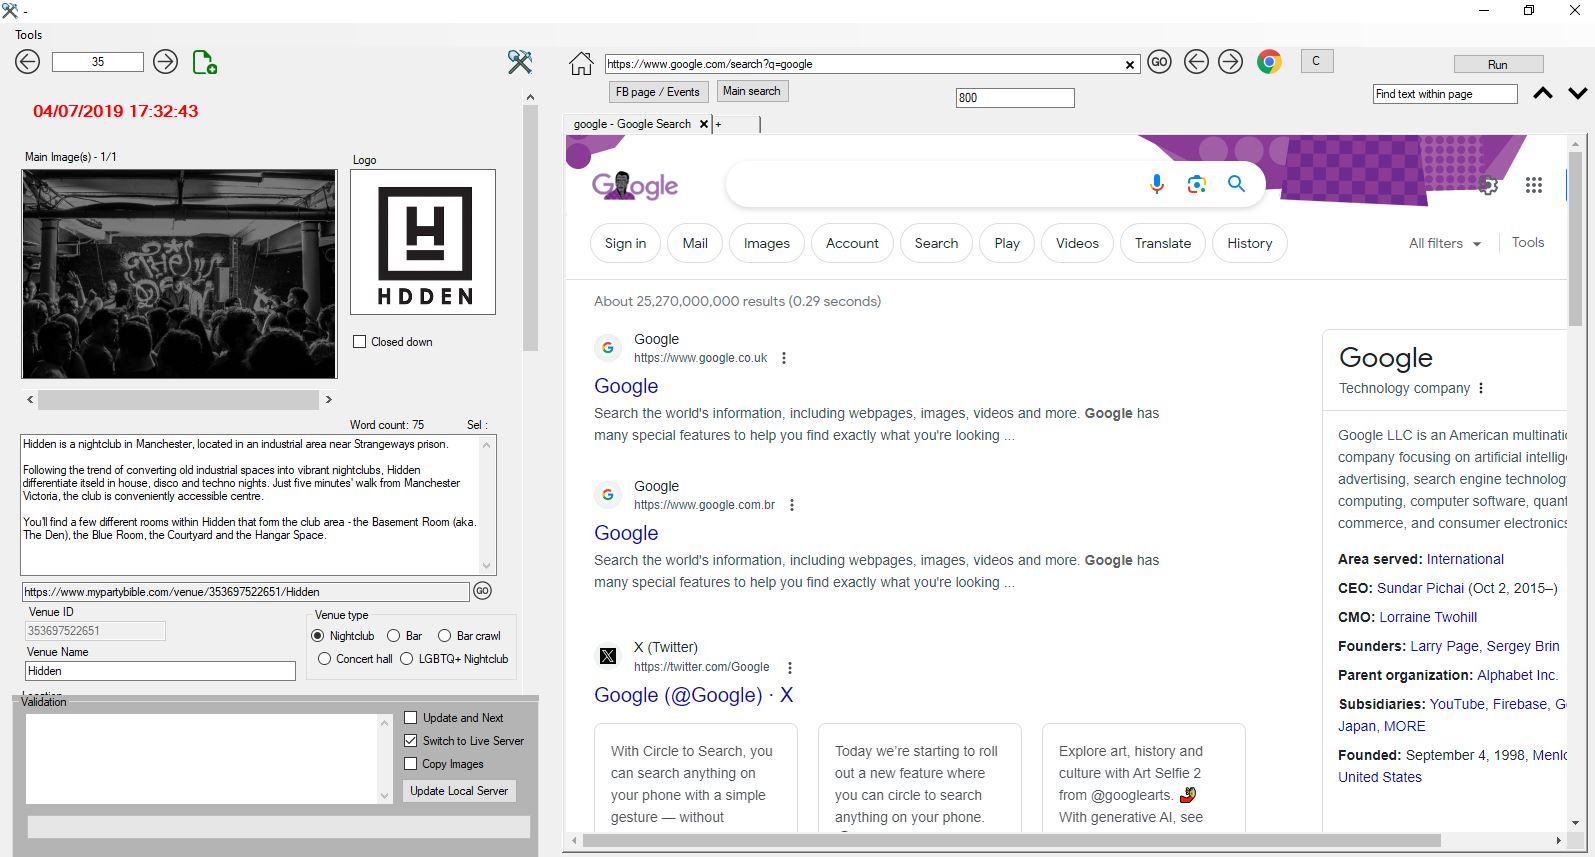
1. Development on in-house VB.net application to mine nightclub and bar data accross the internet in a semi-automated fashion using a embbeded browser (Chromium embedded framework) and javascript commands. All data directly pushed to a mySQL database (June 2019 - August 2020)
2. Web app design and coding. This stage took some time as I had to learn PHP from scratch. (August 2020 - Dec 2020). Website went live in 2020.
3. General content generation and facebook event aggregation service via python (Jan 2020-Jan 2021)
4. Development of Admin dashboard including features to manage business pages, blog editor, send mail campaign and visualise website analytics. (Jan 2021-June 2022)
5. Development of Business dashboard to allow businesses to edit their page, control event aggregation and add more pictures. (June 2022-Jan 2023)
6. Upgrading and automating back end services and business development activities. Addition of Whatsapp community features. (Jan 2023-Jan 2024)
Screenshot 2: Miner App General User Interface
Technology used
Front end: HTML5, jQuery
Back end: PHP, mySQL
Event aggreation: Python3 script on a cron job
back end tools for maintenance: VB.net
Graphics: Photoshop
Coding editor: VSCode, Microsoft Visual Studio
Version Control: GitHub
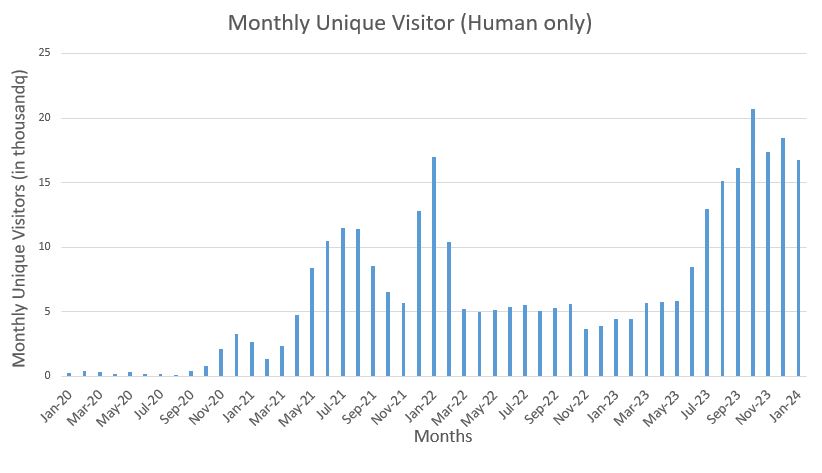
Analytics
The website went live in January 2020 (Just a few month before the start of the Covid-19 pandemic). It tooks many months for the website to pick up steam and the content to be indexed by Google bots. Here is a simple overview of the daily unique visitor growth over time. From 2020 up to now.
Screenshot 3: Unique monthly visitor growth from 2020 to 2024
Roadmap 2024
Focus on onboarding more businesses and add value to business accounts
List more businesses to subsequently generate more traffic. Improve general SEO
Trial of new monetisation avenues such as commission-based ticket sales and affiliate links
Assembly line balancing and Yamazumis
Disclaimer: To protect confidentiality, the data presented in this blog post has been modified and does not represent the actual data used at Cox Marine. Captions, labels, and other identifying details have also been altered where necessary. While the data shown is illustrative, the underlying work, methodology, and resulting outcomes are based on genuine projects and accurately reflect the approach and results achieved.
All world class manufacturing company run an a manufacturing execution system (MES) that offers build technicians a user-friendly interface to build assemblies and interact with tools and machinery. The key advantage of such system is to track build progress, timings and build data that becomes the manufacturing history of the assembly. Collecting large amount of data is essential to prioritise improvement areas that will result in the largest productivity gain with the least effort.
A common strategy to approach continuous improvement is the following:
1. Establish the data collection strategy
2. Visualise and Analyse the baseline data
3. Derive improvement program and quantity their potential impact. Execute highest yielding improvement program and re-assess against the baseline to quantify gain
The data collection strategy
The MES is the interface between build technicians and automated devices such as tools and PLC-connected machines and where 99% of the machine data transits before being collected. The nature of the machine data mainly consists of tightening, gauge and acknowledgment data. In addition to machine data, quality inputs are also collected to produce the assembly manufacturing history. This includes part serial numbers, quality gate defects or specific production issues encountered by build technicians during the build. Each step of the build is timed and all worked times are also part of the manufacturing history. All this data is fed back into the system and centralised in a T-SQL database across various tables.
Visualise and analyse the baseline data
Data is principally extracted from the database using custom and complex T-SQL queries and packaged as JSON objects. As advanced visualisation tools are not available out-of-the-box in the MES software custom dashboards or applets (using HTML, CSS, and AngularJS) had to be created from scratched. This allowed to transform and manipulate the data to create various visually-compelling dashboards to view the live production data with a great degree of customisation.
For highly resource-intensive SQL request (3-4s+ to compute) providing custom identification data, various custom and small tables were created for caching purposes. This implementation had massive speed benifits across all dashboards
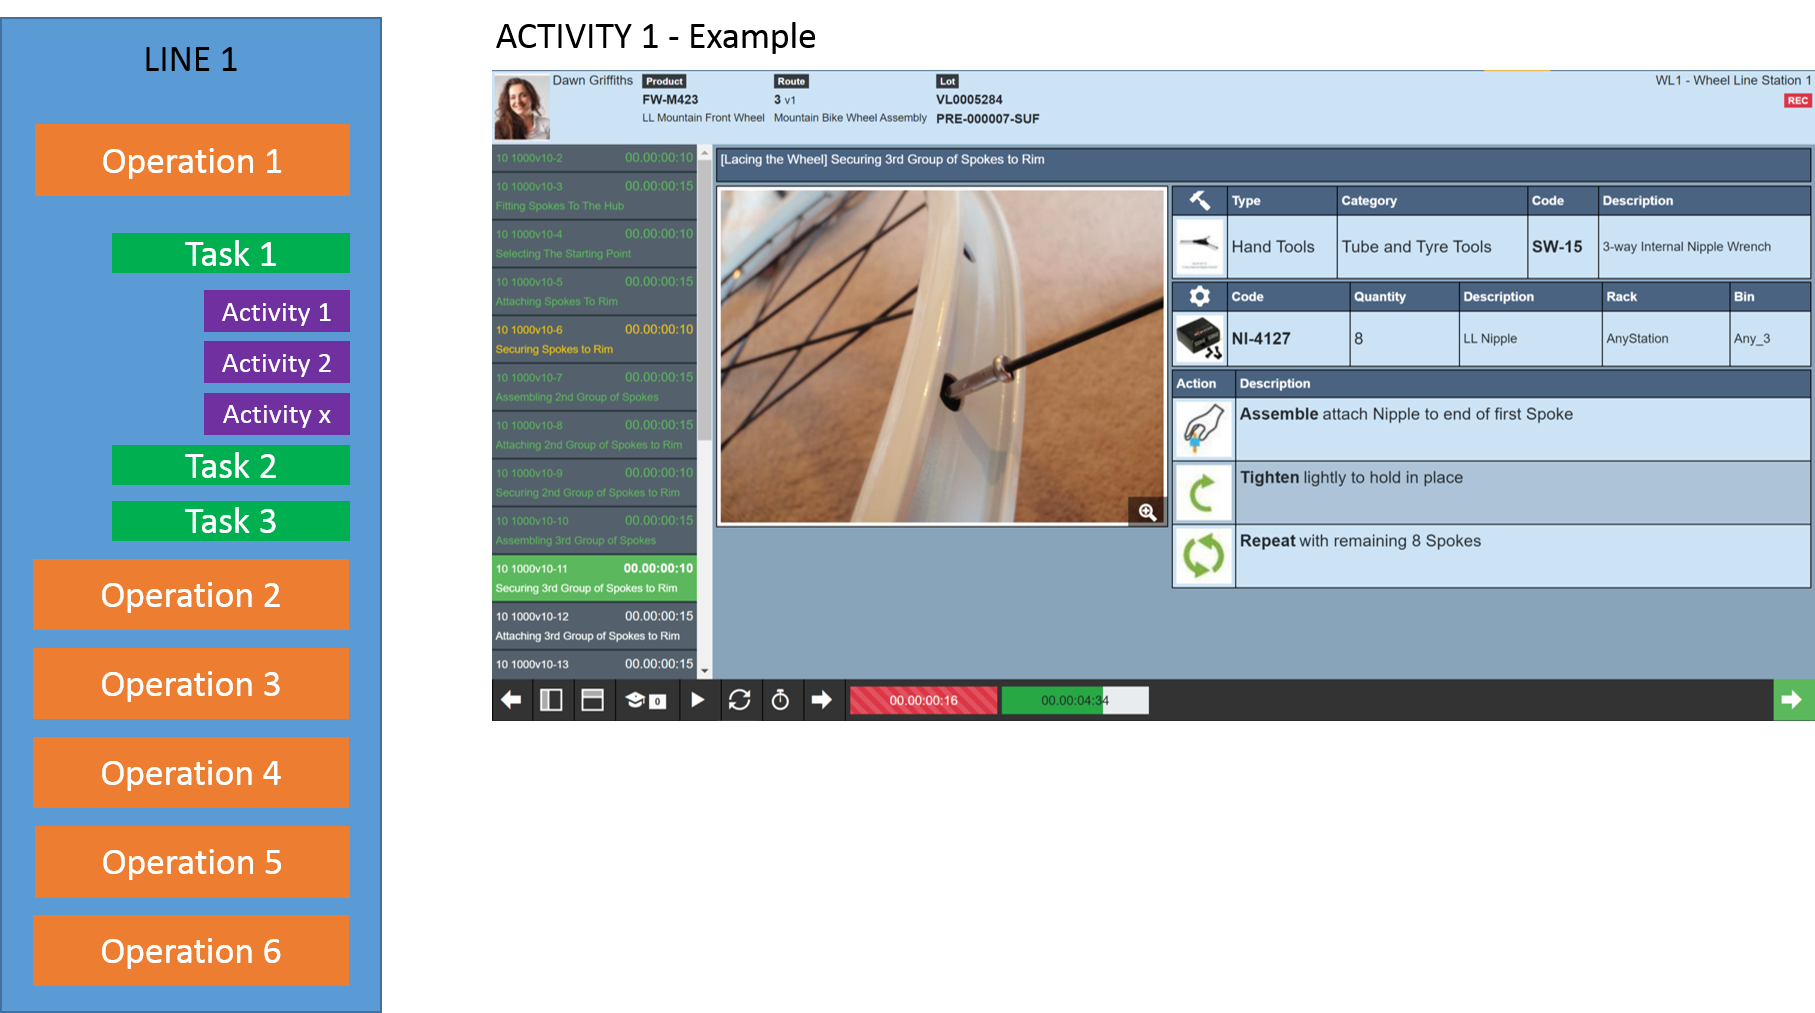
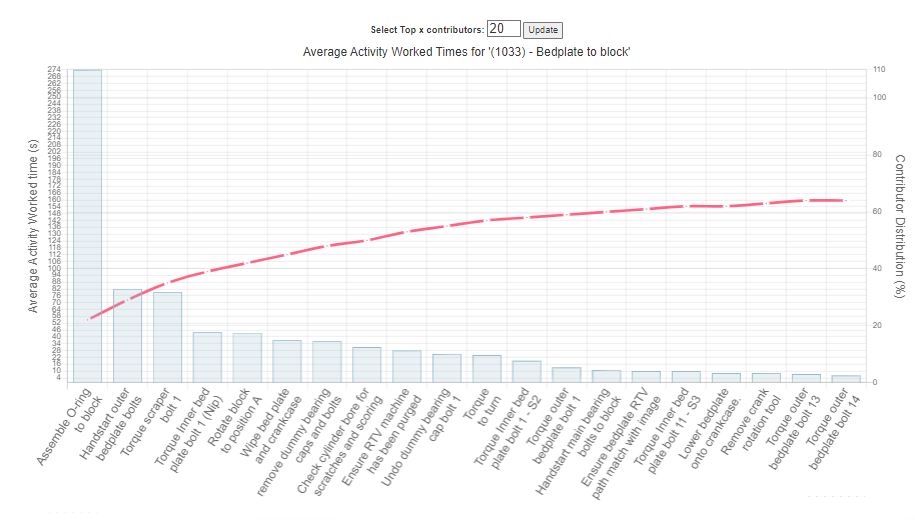
One of the applet created gives an overview of worked time taken to complete a step (usually 2-3 actions), a task (a set of steps), an operation (a set of tasks) for a given production line (Figure 1). The applet allows to drill down to individual steps to identify the Top x steps that take the longest within a task. (Figure 2)
Figure 1: Hierarchy between operations, tasks, and activities
Figure 2: Activity worked times Pareto
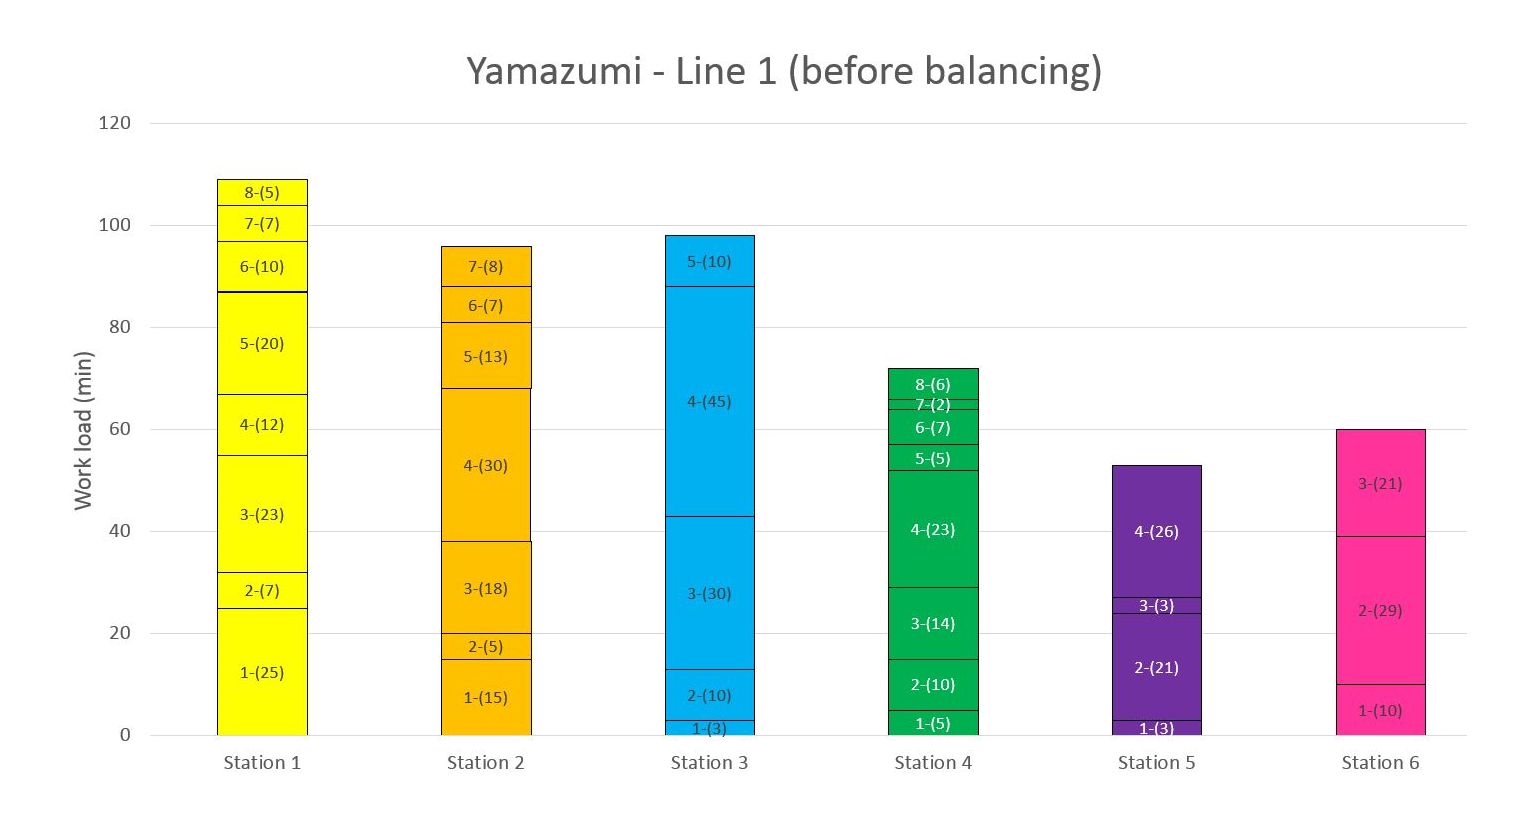
At Cox all production lines are set in a single piece flow configuration, so each assembly is built one-by-one and moves in sequence from one station to another until it reaches the end of the line. In an ideal scenario, each station should take the exact same amount of time (TAKT time) so the assembly flows without delays between stations. A line is said to be perfectly balanced when the time taken to complete each station is equal to the TAKT Time.
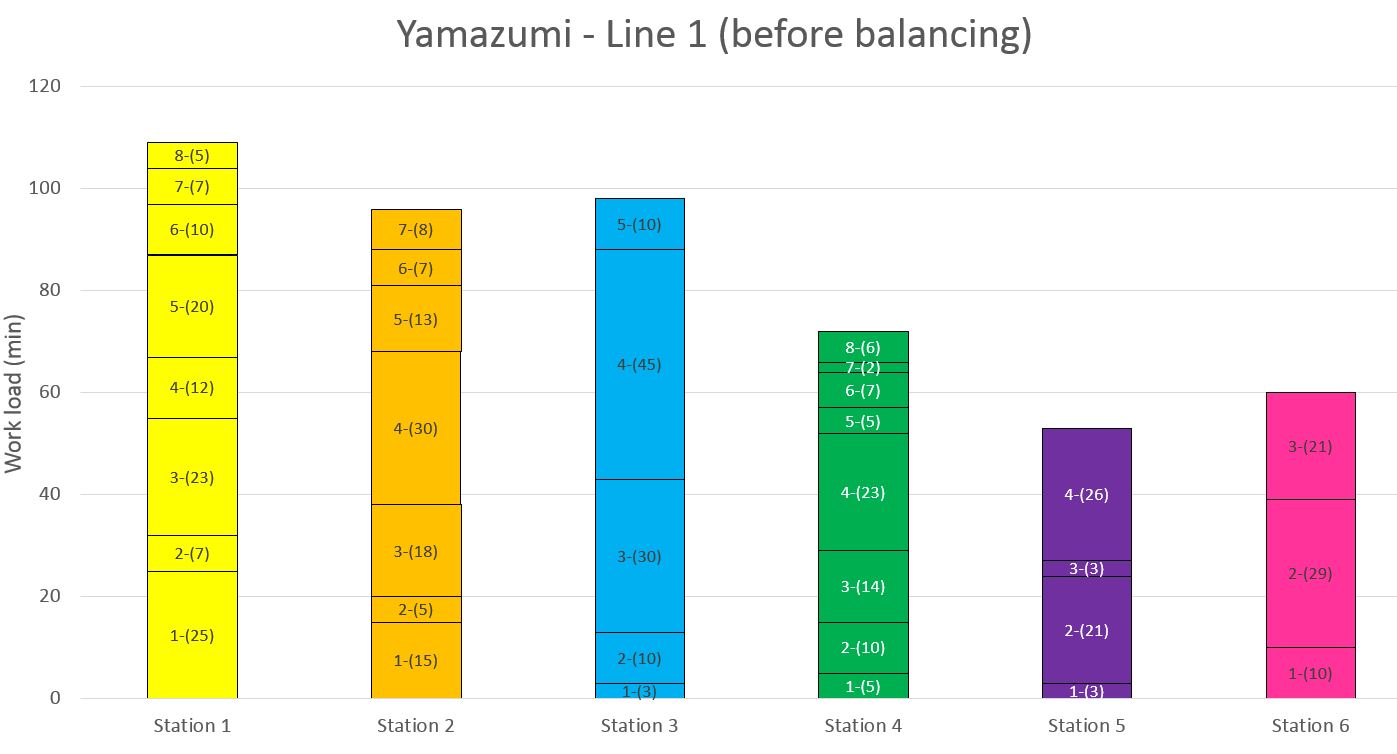
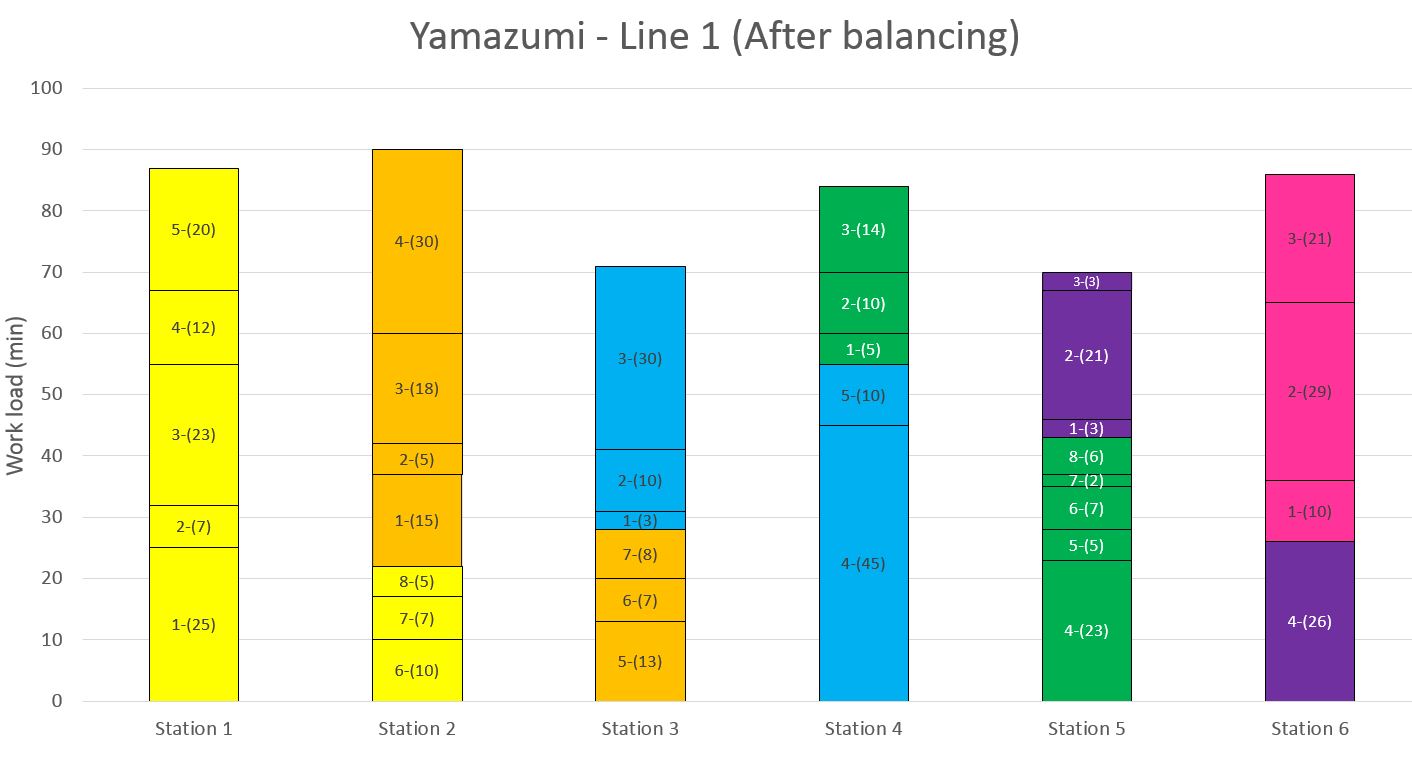
To illustrate the above, a Yamazumi chart can be used. It is a stacked bar chart that breaks down each operation work load by small work load chunks (i.e. tasks). The height of the bar indicates the work load at a given station. To improve productivity and efficiency one seeks to level out the Yamazumi chart by moving around some the work load between stations.
Derive improvement programs
There are at least 3 options to balance the Yamazumi:
1. Move/Split work load between station
2. Shrink/Eliminate work load
3. Add extra stations
Options 1 and 2 are usually the easiest and most convenient to pick from as they require less resources compared to option 3. To construct the Yamazumi chart worked times data from the last 100 engines is extracted from the database and broken down into tasks. The median is used instead of a simple average, this is remove any outliers due to training or other anomalies that occurred on the production line. The next steps consists of identifying tasks were some of the work load can be eliminated or moved to a different station.
Some of the key levers to decrease process times are automating the process with PLC-driven equipment, removing or speeding up rundown stages, replacing manual RTVing process with a liquid rubber seal, eliminating unnecessary screw-based fixing such as clamps or p-clips with quick fit clips. However, all part changes made to an engine must undergo rigorous testing and backed up with trial data.
Moving or splitting the work load is not always the obvious path forward. Indeed, some constraints exist such as the tooling/machinery present at each station which can't always be duplicated, moving certain activities out of sequence is not always feasible as it might restrict access to the subsequent part fitment. In preparation to physically rebalance the line the current and projected Yamazumi chart can be derived (Figure 3 and 4). In this example, no work has been moved out of sequence or optimised to cut worked times. It is obvious that levelling out a Yamazumi perfectly across all stations with large TAKT times is not trivial.
Figure 3: Yamazumi before line rebalancing
Figure 4: Yamazumi after line rebalancing
Rebalancing the line
Rebalancing a line physically can quickly become a mammoth task entailing weeks of work to complete. Indeed, equipment, machines and parts are likely required to be moved to the appropriate station. Instructions would also need to be updated if work is moved out of sequence (as images might show parts not yet fitted). Subsequently new part locations will need to be updated for the material control to adjust and replenish stock line-side.
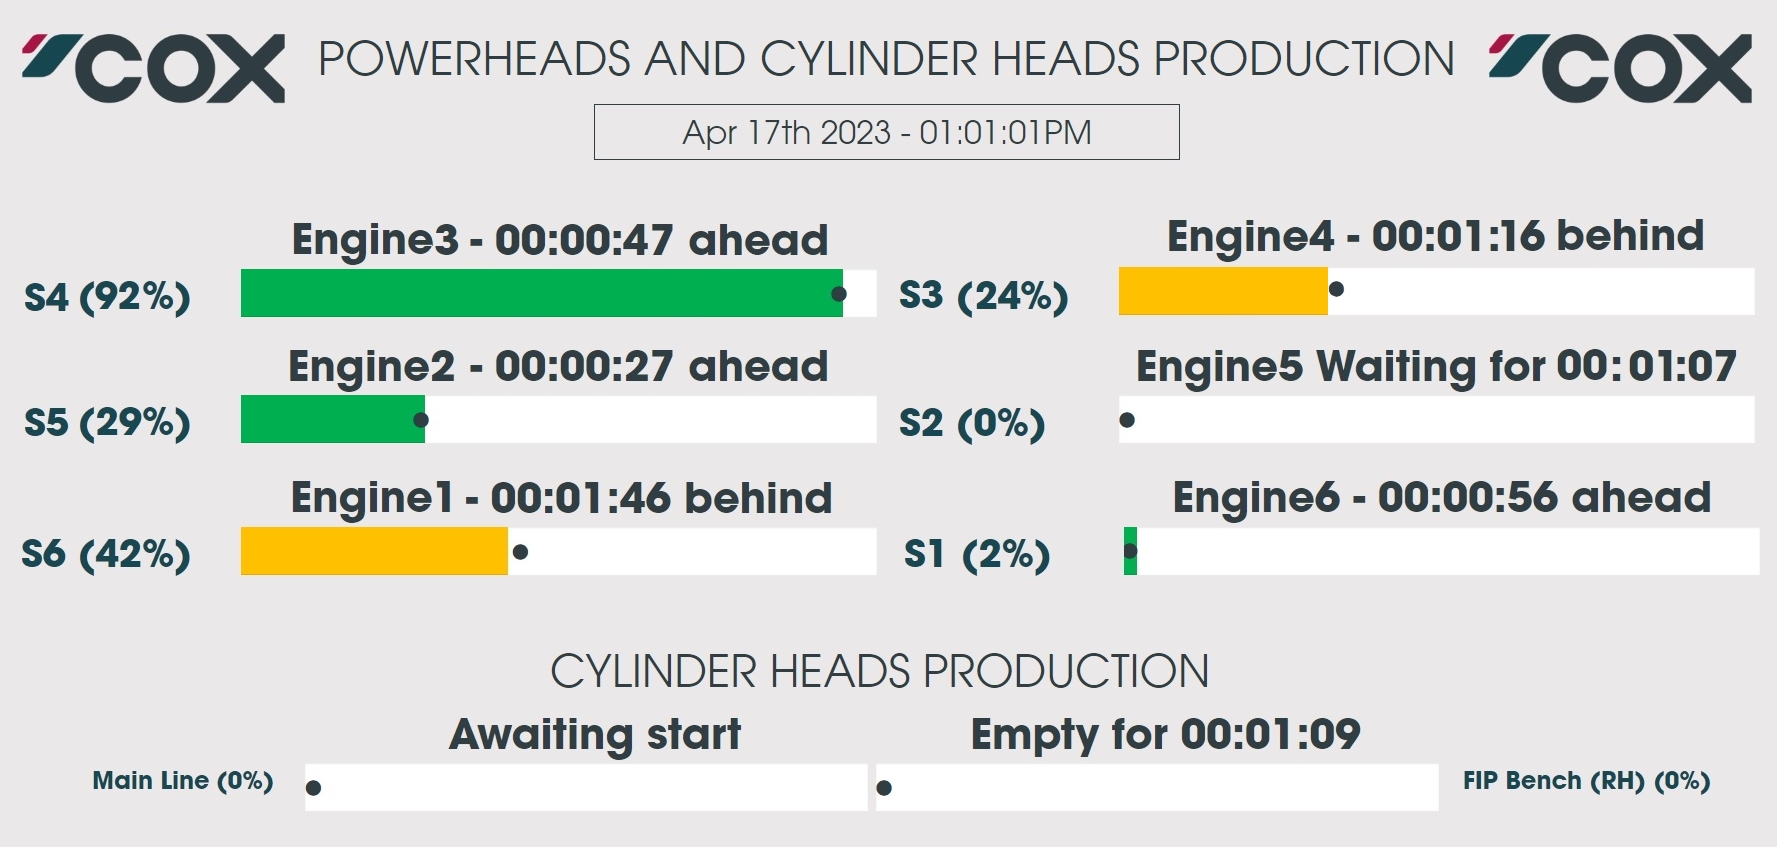
Once the instructions have been re-arranged and timings updated, it can take up to 2 weeks for the build technicians to acclimate to the changes and hit consistent worked times. To help with that the factory is equipped with large TV screens displaying a progress bar per station with a pacemaker (Figure 5), this helps team leaders visualise bottleneck on the line in real time and tackle on-going issues.
Figure 5: Build progression dashboard with pacemaker
Dashboards and apps
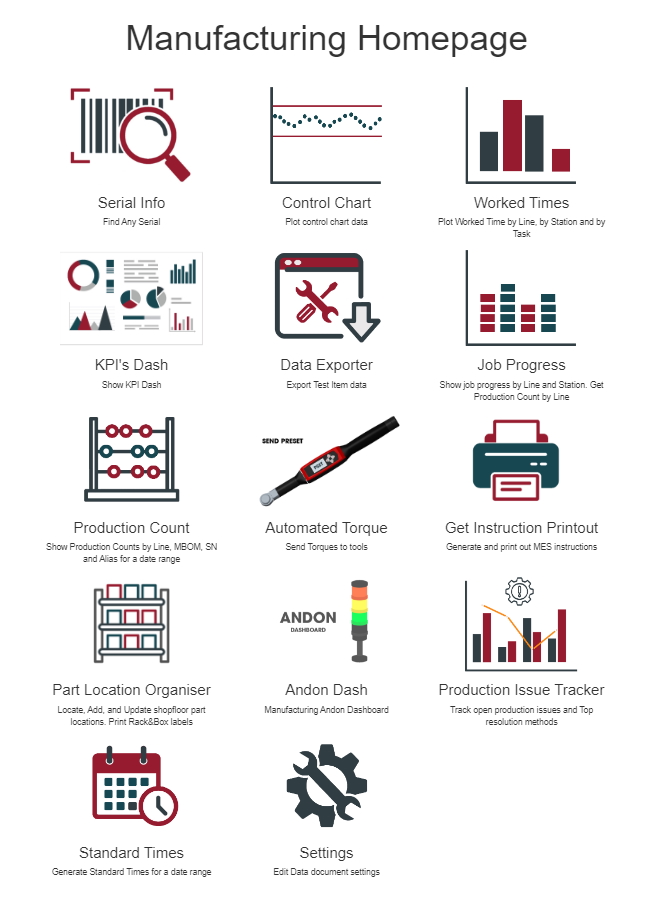
I designed and created a serie of apps and dashboards to facilitate all continuous improvement activities, visualise key performance indicators (KPIs) and gain quick access to relevant manufacturing information. (Figure 6) One of the widely used app in the business was the 'Get Serial Info' app that allowed to pull key manufacturing info about an assembly from a engine number, lot number, serial number or part serial number. It would also allow building a tree-like hierarchy of a assembly and all its sub-assemblies.
Figure 6: MES homepage allowing access to various apps and dashboards
Predictive Shimming of outboard transmissions
Disclaimer: To protect confidentiality, the data presented in this blog post has been modified and does not represent the actual data used at Cox Marine. Captions, labels, and other identifying details have also been altered where necessary. While the data shown is illustrative, the underlying work, methodology, and resulting outcomes are based on genuine projects and accurately reflect the approach and results achieved.
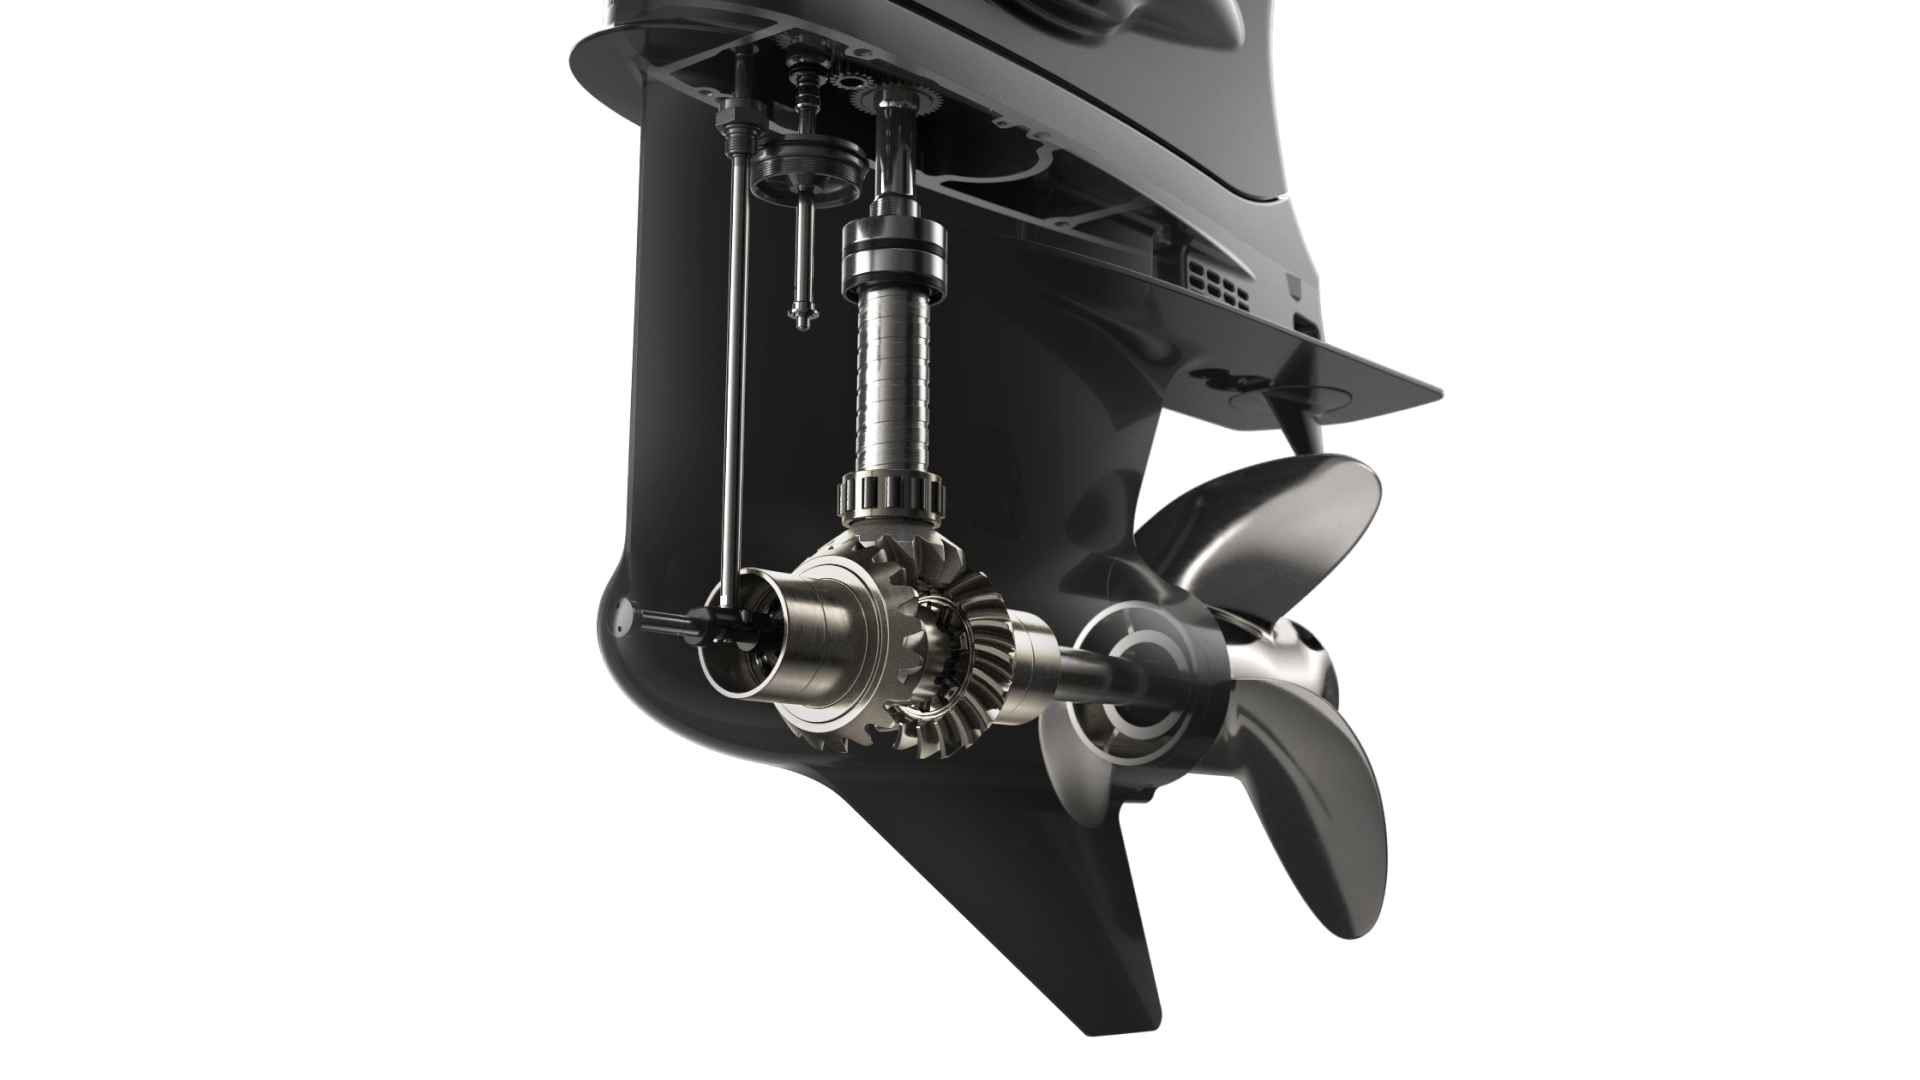
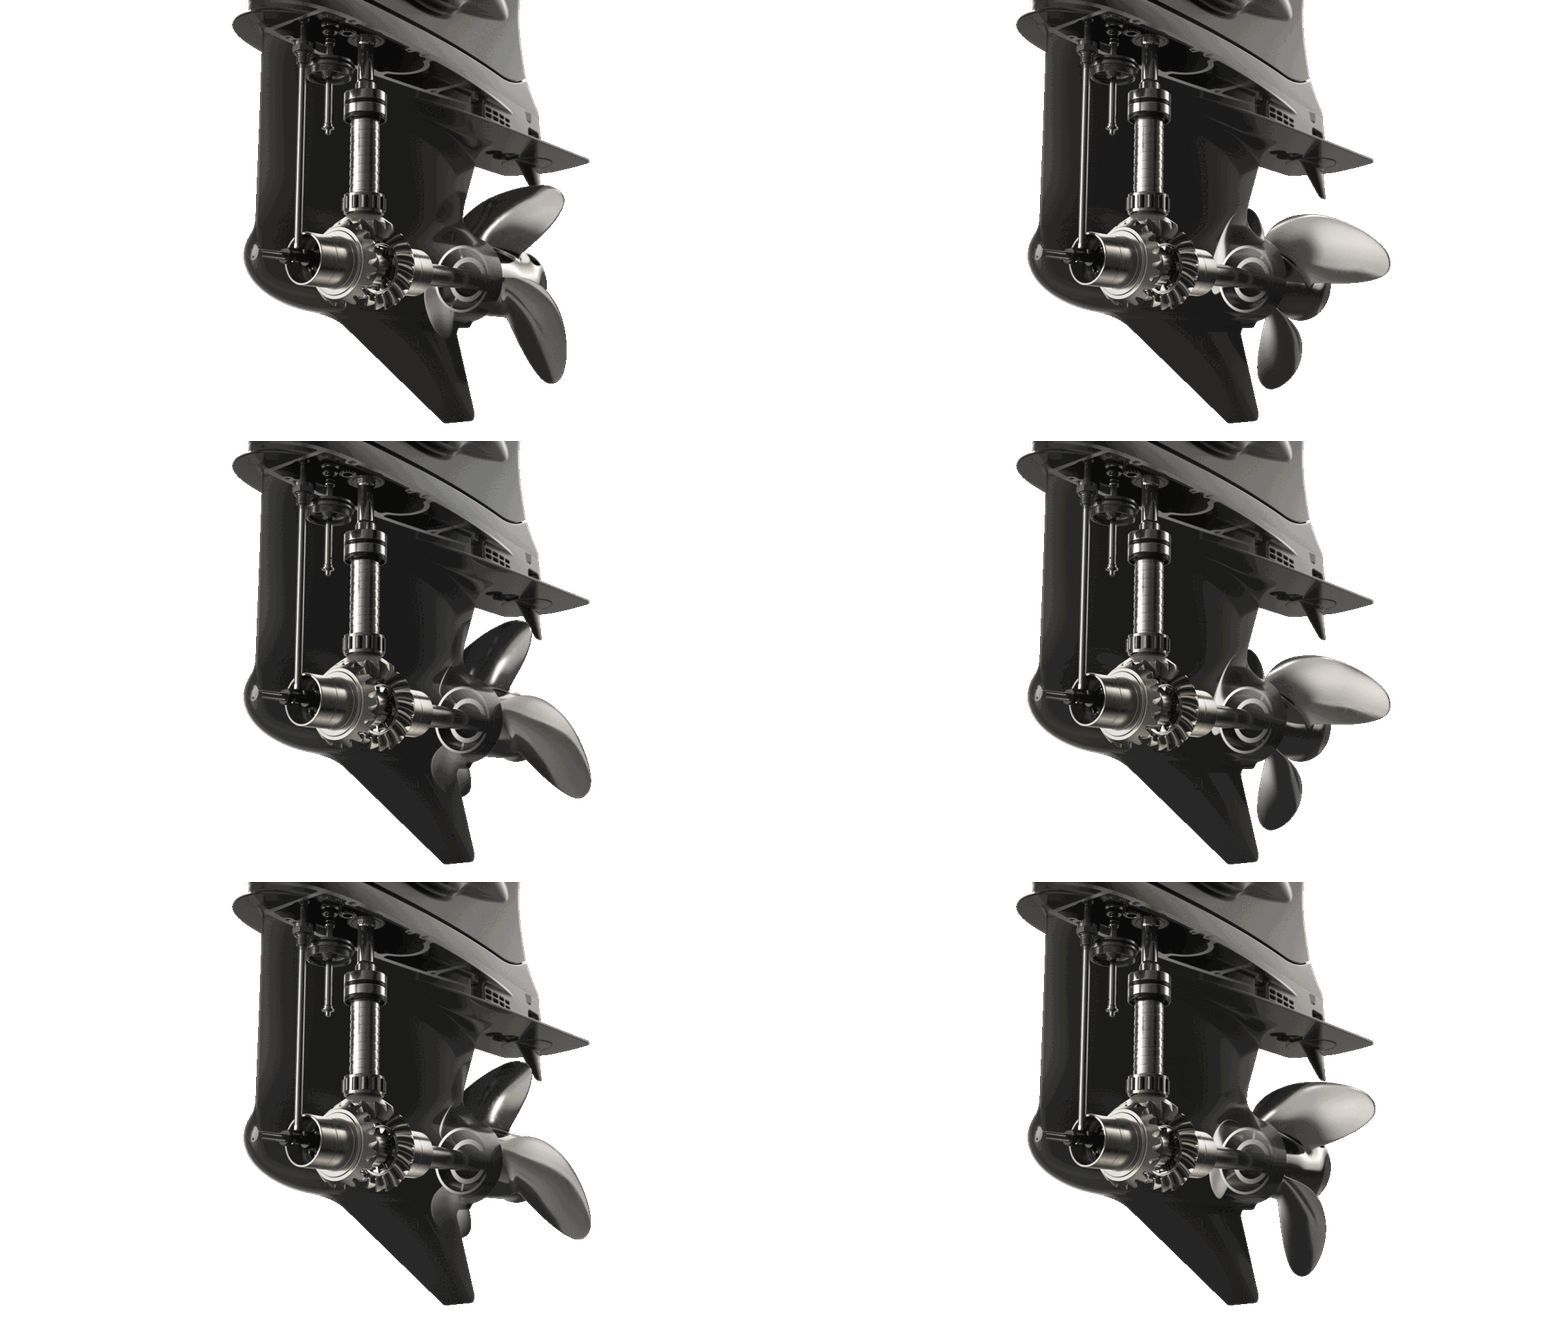
A key component of a diesel outboard engine is the transmission made of machined out aluminium casting comprised of an input shaft (vertical) sliding into the powerhead and and output shaft (horizontal) where the propeller is affixed. The input rotational force created by the engine is converted to the output shaft via a set of 3 gears, namely the pinion, rear and front gears. Various bearings and shims are also required to build a working transmission
The machined aluminium transmission housing has its bores and steps machined to a certain tolerance so are the various parts making up the assembly. All these small machining variations add up and shims are required to compensate. A total of 5 shims are required to ensure that the gears mesh properly (backlash specification for the rear and forward gear) and that the gearbox allows enough play to shift gears (end float specification). A transmission will be shimmed in specification if it meets its backlash (BL) and end float (EF) specifications.
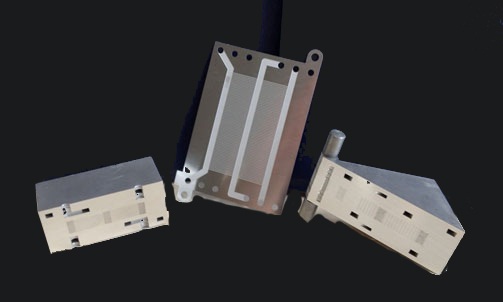
A total of 16 different measurements are required to calculate the 5 shims required. Each shim range approximately contains 15 different shims with an increment varying from 50um to 100um. The Manufacturing Execution System (MES) uses some of the 16 measurements to predict the correct shim and lights up the matching PTL location. In most cases the nearest shim is picked which means that in the worse case scenario the measured value could be off by 25/50um versus the actual calculated value. This might appear like a negligible error but it is often compounded by the fact that all gauges can measure up to a certain accuracy and noise can add up quickly if the shim calculated value is derived from 4 measurements. Other sources of inaccuracy can also originate from slight variation of mating face flatness or bore perpendicularity.
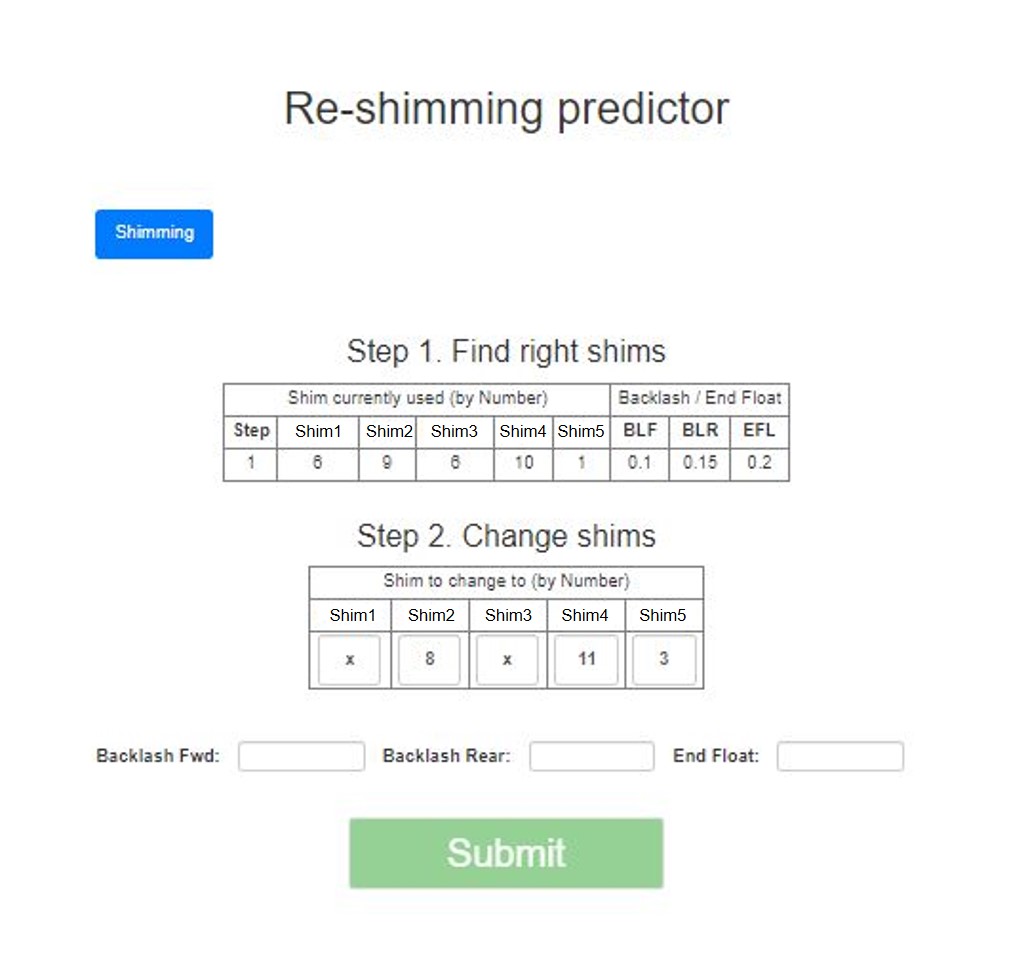
In some instances, it is possible to experience out-of-specification BL/EF transmissions that need re-shimming. Re-shimming means re-adjusting the shims to bring the BL/EF values in specification, to do so one or more of the 5 shims need to be replaced with a thinner or thicker grade. Predicting the right shim set mentally to bring the BL/EF values back into specification is challenging and requires some practice to master.
In the early days of the transmission production line, there was no system in place to automatically predict how the shims should be replaced, it was done mentally by the build technicians. Unsurprisingly, this led to variable production times for this part of the process as some operators were more experienced than others. One of the improvement activity I implemented was to eliminate any operator input from this process. I developed a re-shimming predictor that could be embedded within the instructions and capable of predicting the right shims for any BL/EF scenario. (Figure 2)
Figure 2: Screenshot of the re-shimming predictor app
K-nearest neighbour (KNN) classifiers
The first approach considered was to attempt to classify each scenario using a K-nearest neighbours method. In practice, each re-shimming step had a set of starting shims (inputs) and out-of-specification BL/EF measurements (outputs) and a final set of shims and in-specification BL/EF. Applying the KNN method to this process assumes that replacing the shims by a specific increment/decrement should yield the same increment/decrement in the BL/EF values for the same scenario over time.
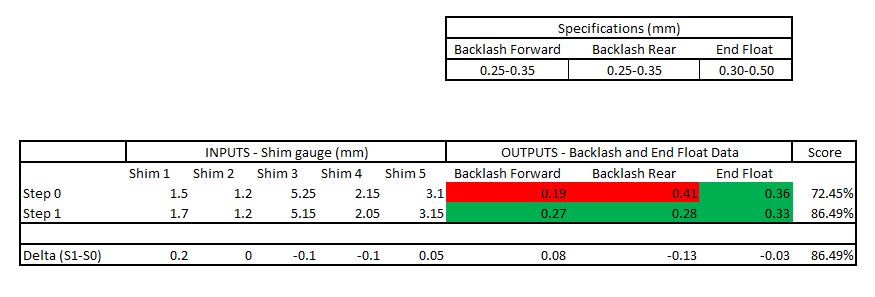
To take advantage of KNN method, one needs to score and rank each re-shimming step. For example, if after a re-shim the BL/EF values fall precisely in the middle of their respective specification range then it would get a score of 100%. A score of 0% would be attributed to the worse re-shim scenario ever recorded (when no automated process was implemented).
Effectively, the score is the distance to the perfect case scenario. In practice, after each re-shimming the applet would store (5 shims increment/decrement in nominal values and 3 outputs which are the correspond BL/EF delta values). At the beginning of the re-shimming process, the applet would look for the nearest re-shimming scenario experienced in the past and with the highest score (probability of re-shimming right first time). Another capability of the applet was to combined individual re-shimming steps to create a single re-shimming step with a higher score. (Figure 3).
Figure 3: Classification of each re-shimming scenarios based on user input
This algorithm was constantly being reinforced by operator input, as the database grows, scenarios with higher scores start to emerge, this was a simple way to provide some guidance to the operators regardless of their experience or ability. However, the algorithm started to derail when some of the values were wrongly measured and inputted in the database. The main downside with self reinforcing algorithm was operator error which was difficult to control at the time, especially for trainees. This method was potentially not robust enough when it came to changes to the shim range or specification updates as a new learning phase would have been required to adjust. Another approach had to be implemented to address the aforementioned shortcomings
Functional model
The alternative approach was to use a functional model which is basically a function that would take out-of-specification end float and backlash values as inputs and spit out the correct set of shim increment/decrement to meet the middle of the BL/EF ranges. Initially, it was unclear if a linear function could be found to address predictive re-shimming. The initial idea was to create a database with all possible scenarios and simply query the result based of the BL/EF deltas. Eventually, a robust algorithm was found to predict the correct shim changes. Every re-shimming steps were also recorded for later analysis and optimisation of the model. Analysing the data showed that in particular scenarios the re-shimming predictor was off by a few shim increments and this was observed on low BL/EF values. Specific offsets were introduced to compensate.
To date the functional model is still in use and is performing very well with 90% of predictions being right first time.
Manufacturing Systems and IOT automation
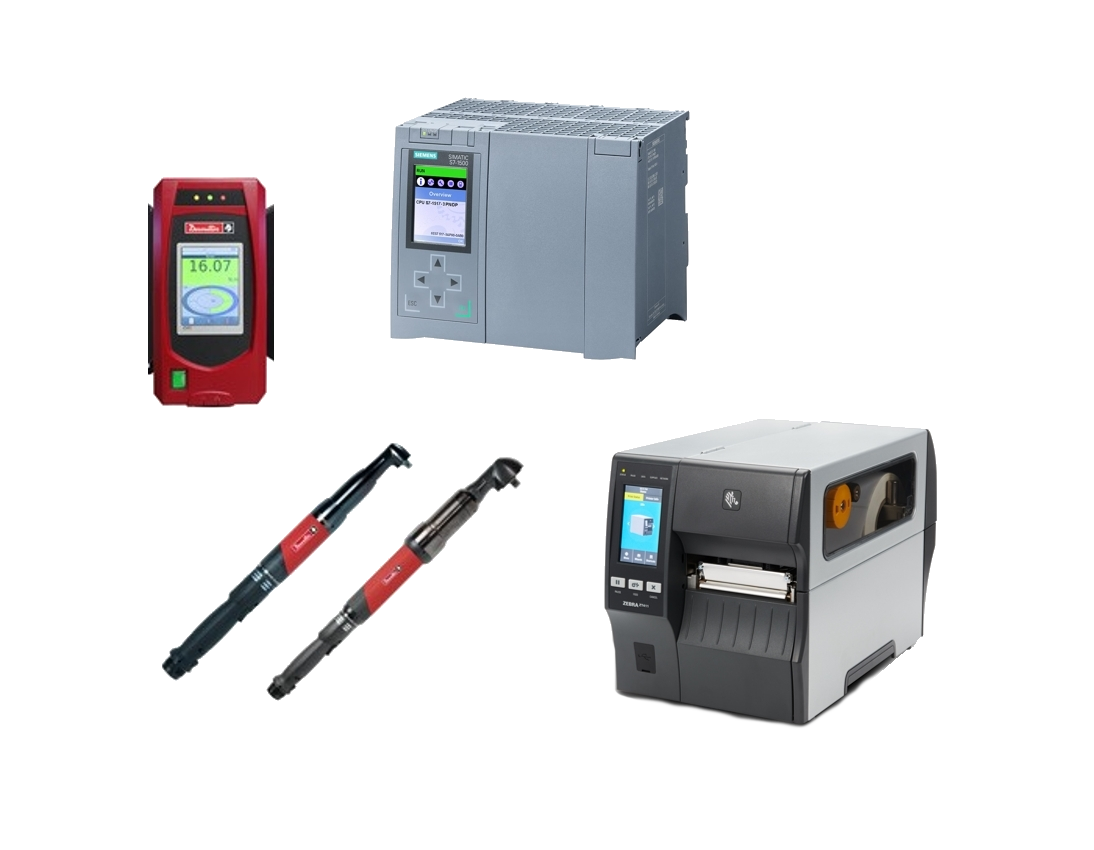
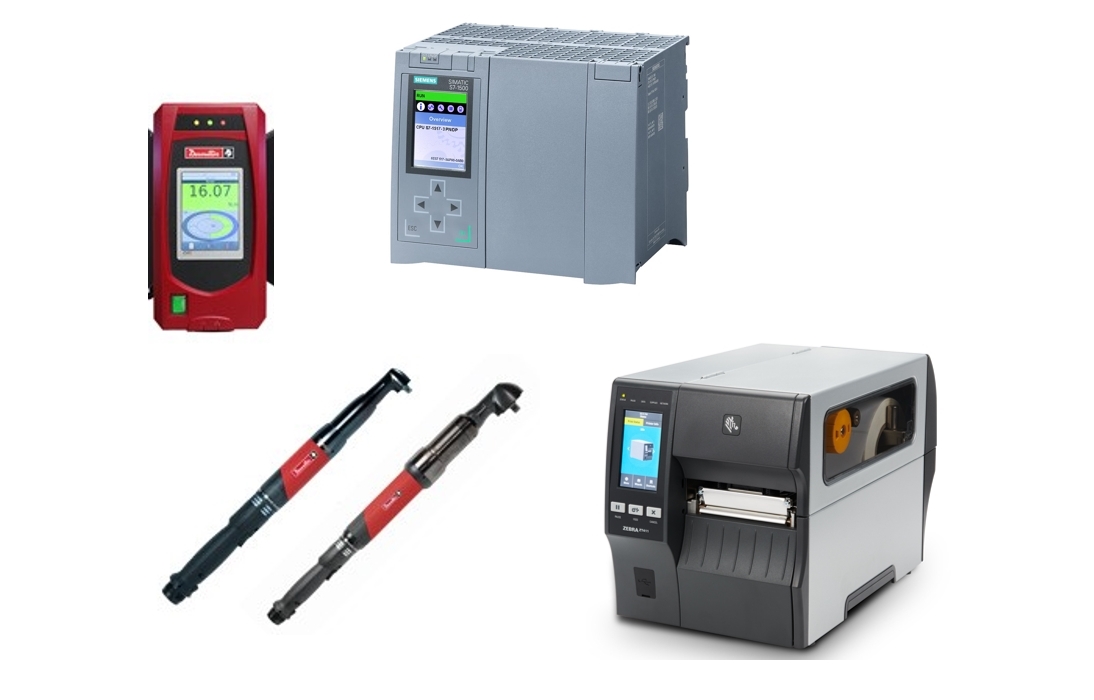
Most high-volume assembly lines in world exhibit some degree of automation served by network-connected devices, Cox Powertrain assembly lines are no exceptions. Ranging from PLC-controlled machine and automated tools such as motor driven nut-runners and WiFi-connected wrenches to networked leak testers and label printers. All this hardware can be classified as IoT objects.
Figure 1: Example of IoT objects used at COX
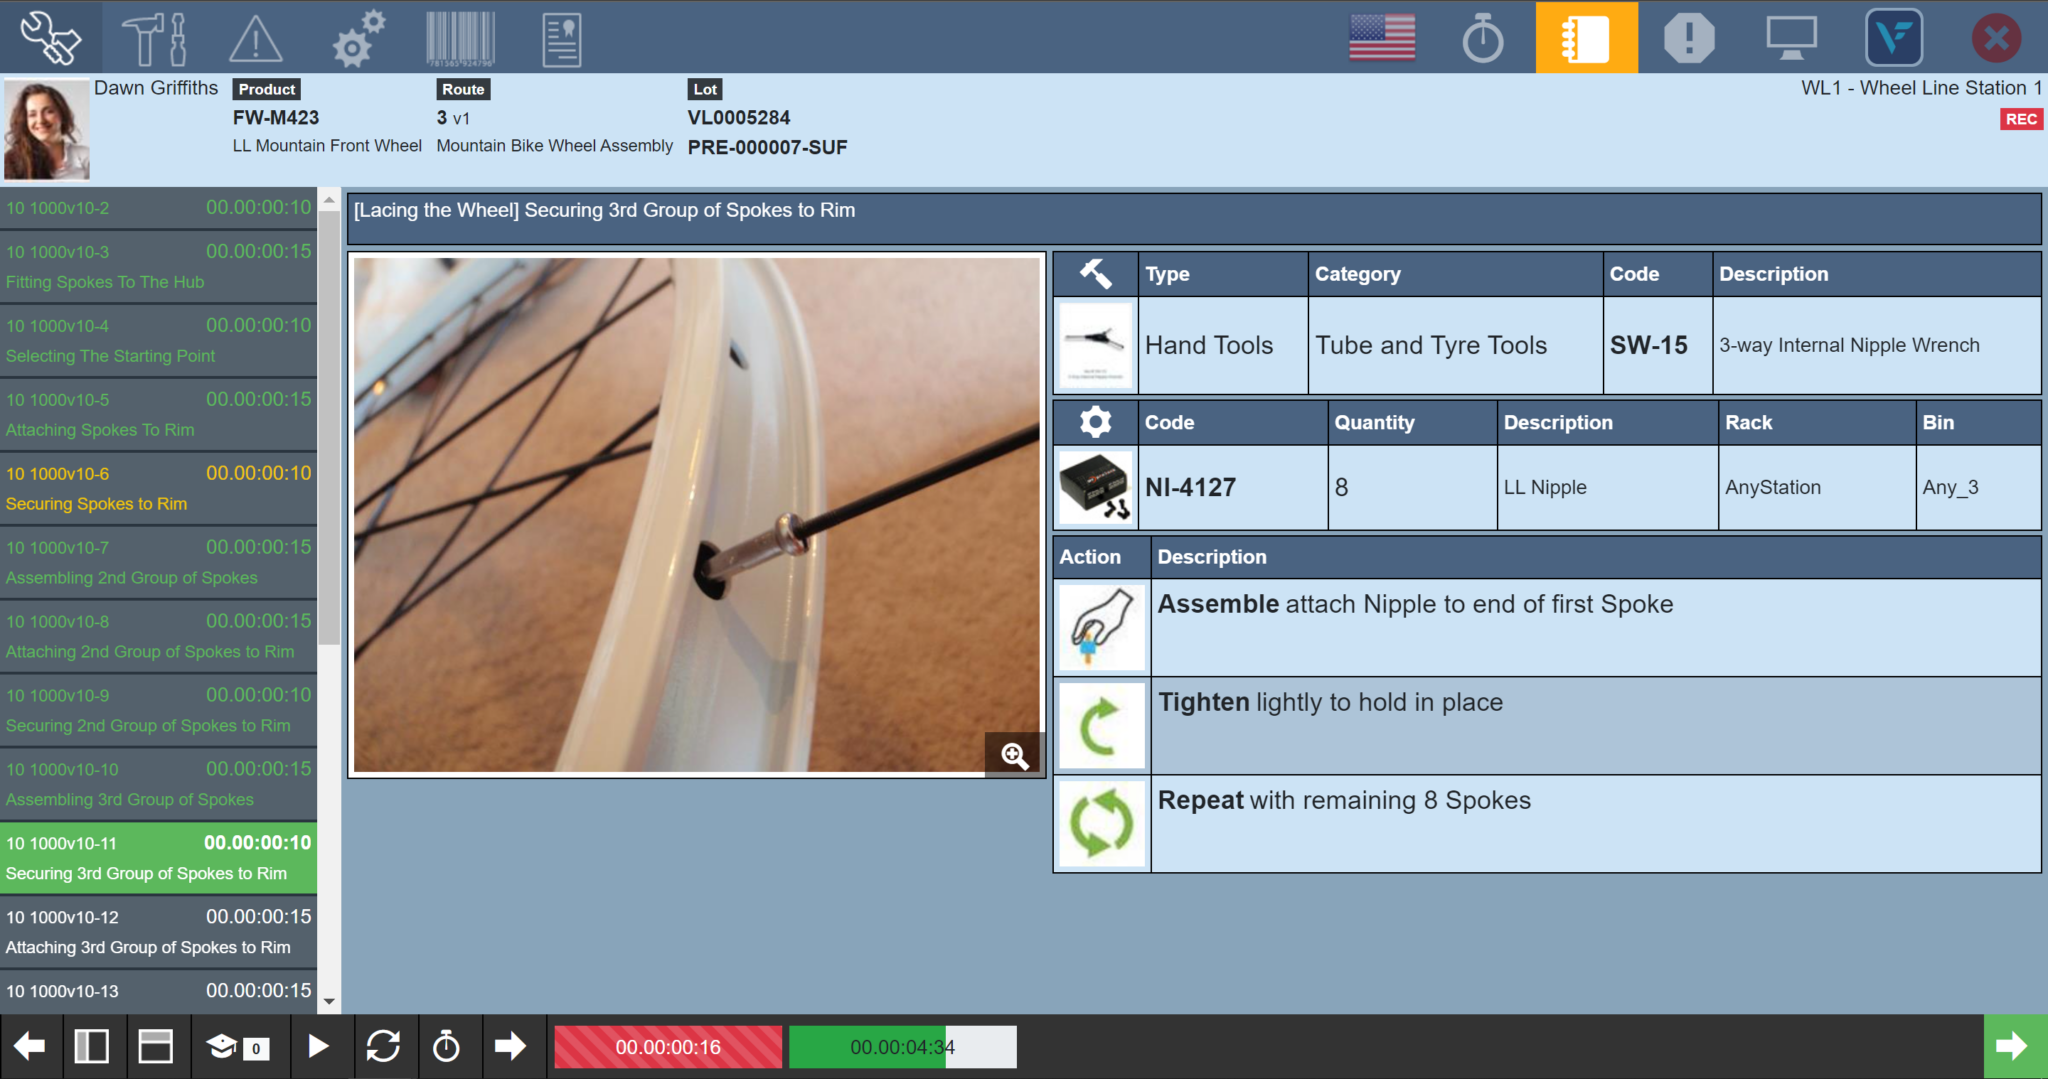
Assembly lines at Cox were driven by operators as opposed to being fully automated, so to bridge the gap between operators and machine, a computer-assisted interface is required. This interface is a piece of software that loads build instructions and seamlessly interacts with the various IoT objects on the network. This interface is the Manufacturing Execution System (MES)
The MES is the brain of the manufacturing operations. It receives works orders from the ERP system and generates the correct set of instructions for each product and display them to build technicians in a powerpoint-like fashion. It can also run various manufacturing equipment and talk to all associated IoT objects connected on the line. (Figure 2)
At Cox, the MES software (supplied by a third-party) runs as a Web app which allows to send various commands to IoT objects and receive feedback when the command completes (the integration between the various system was developed in-house). For example, most devices would return tightening data such as torque and angle values but also gauge data. Some of the PLC-controlled machinery would just return a OK/NOK flag to confirm the operation has successfully run its course or not. This data is then stored in the manufacturing history of each product.
Figure 2: Example of MES instructions without automation
As the business integrated the IoT objects to the line and ramped up production, cracks started to appear in the automation layer of the MES back-end, in a few occurrences the server would freeze and the factory would come to a halt.
The IoT layer
Most IoT objects send/receive data via a bespoke communication protocol, generally over TCP/IP. This third-party MES is coded in ASP.net (back end) and AngularJS (front end). However, AngularJS is not capable of opening a TCP channel with IoT objects. To address this, server-side and long-lived console app (codelet) coded in C# were developed to listen to incoming commands and return data once the IoT object completed its command. These codelets would keep running until the assembly completed moved out of station.
In practice, the MES would create a single instance of the codelet per tool or device type. Cox counted about 50 different IoT devices. In normal running conditions approximately 20 instances of various codelets could run at any one time. It did not take long for some of these codelets to go eery and over consume excessive CPU which in turns would crash the server. Is there an alternative? And yes, why not use a back-end programming language that natively permits to establish TCP/IP channels? node.js enters the chat!
Beyond codelets
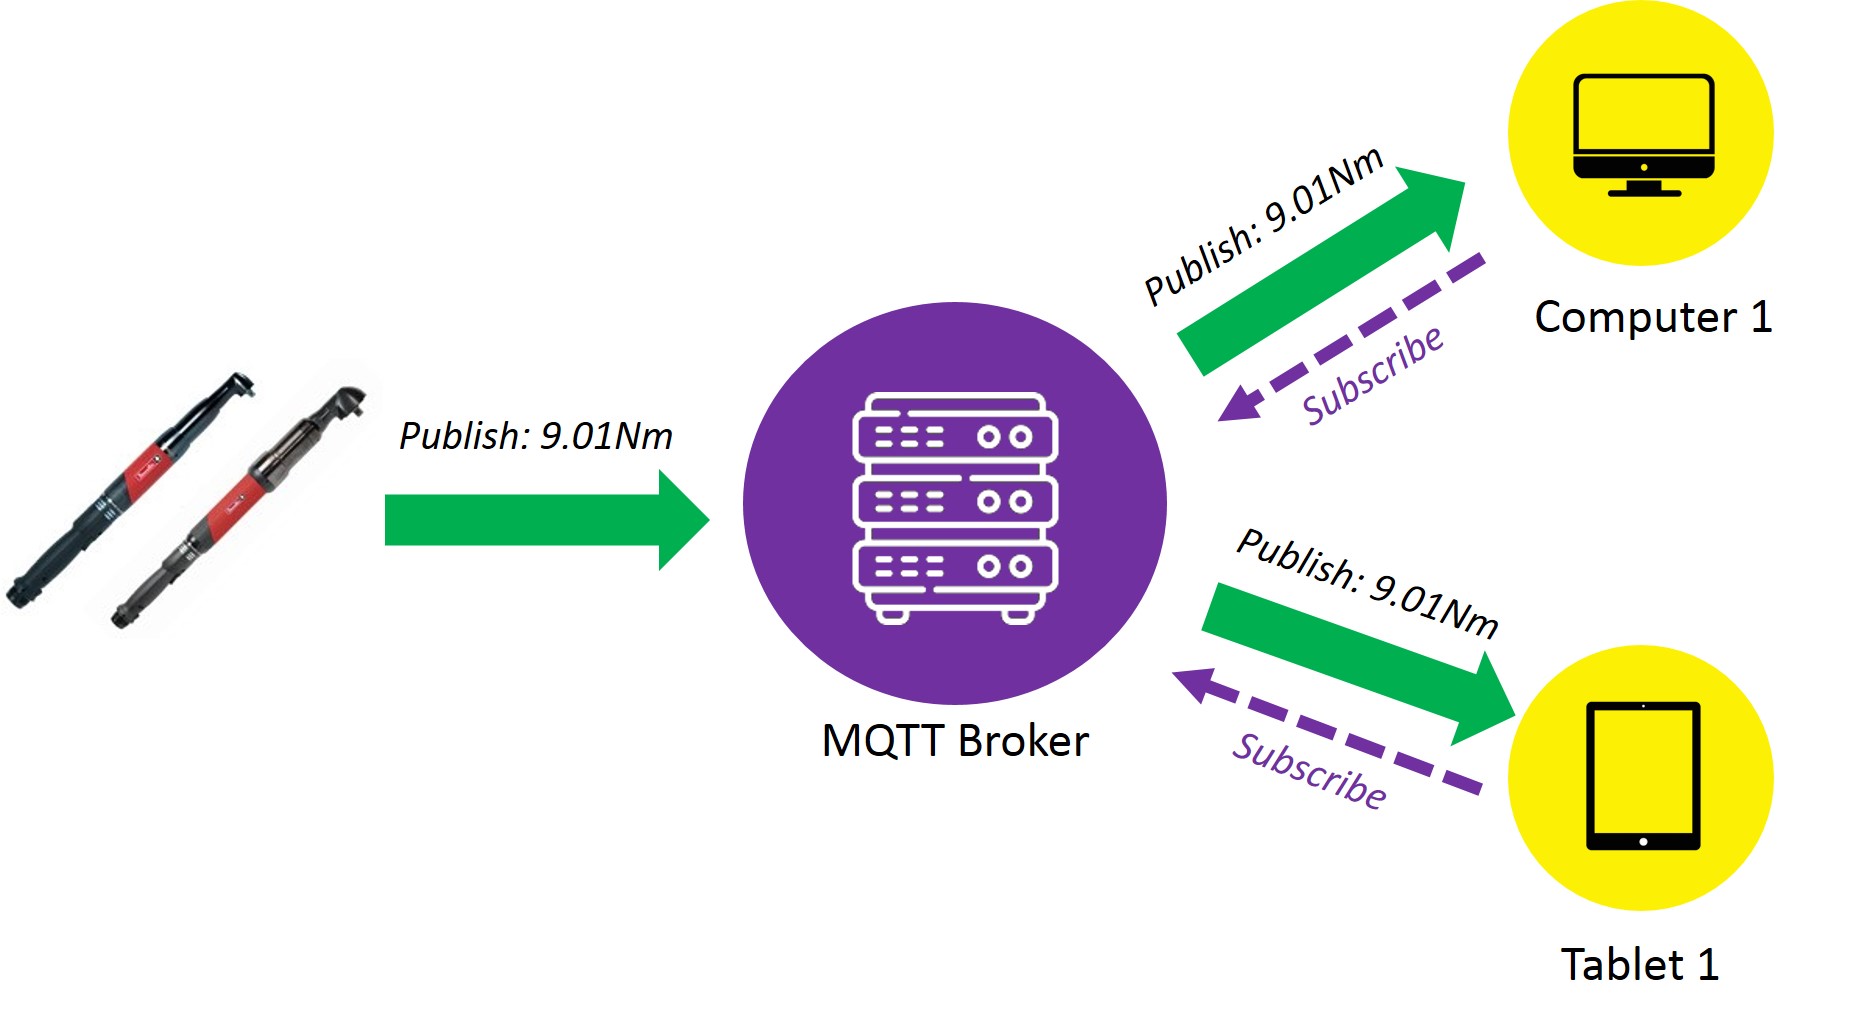
The MES provider realised that codelets were not the right solution for highly automated factories and complex manufacturing environment. In a major overhaul of the automation layer they implemented a MQTT broker and Node-red combo to replace codelets altogether. In shorts a MQTT broker is a web server that acts a little bit like a IRC chatroom where IoT objects or WebApps can publish/subscribe data to/from topics.
Figure 3: MQTT publish/subscribe model
For example, if I want tool1 to trigger command1, I would just publish ´command1' to cox/tooling/tool1/command. The tool would actually subscribe to the same topic and scan for any incoming data. Once the tool has done its job, it would publish the results to the ´result' topic. But there is a piece of puzzle missing: Node-red.
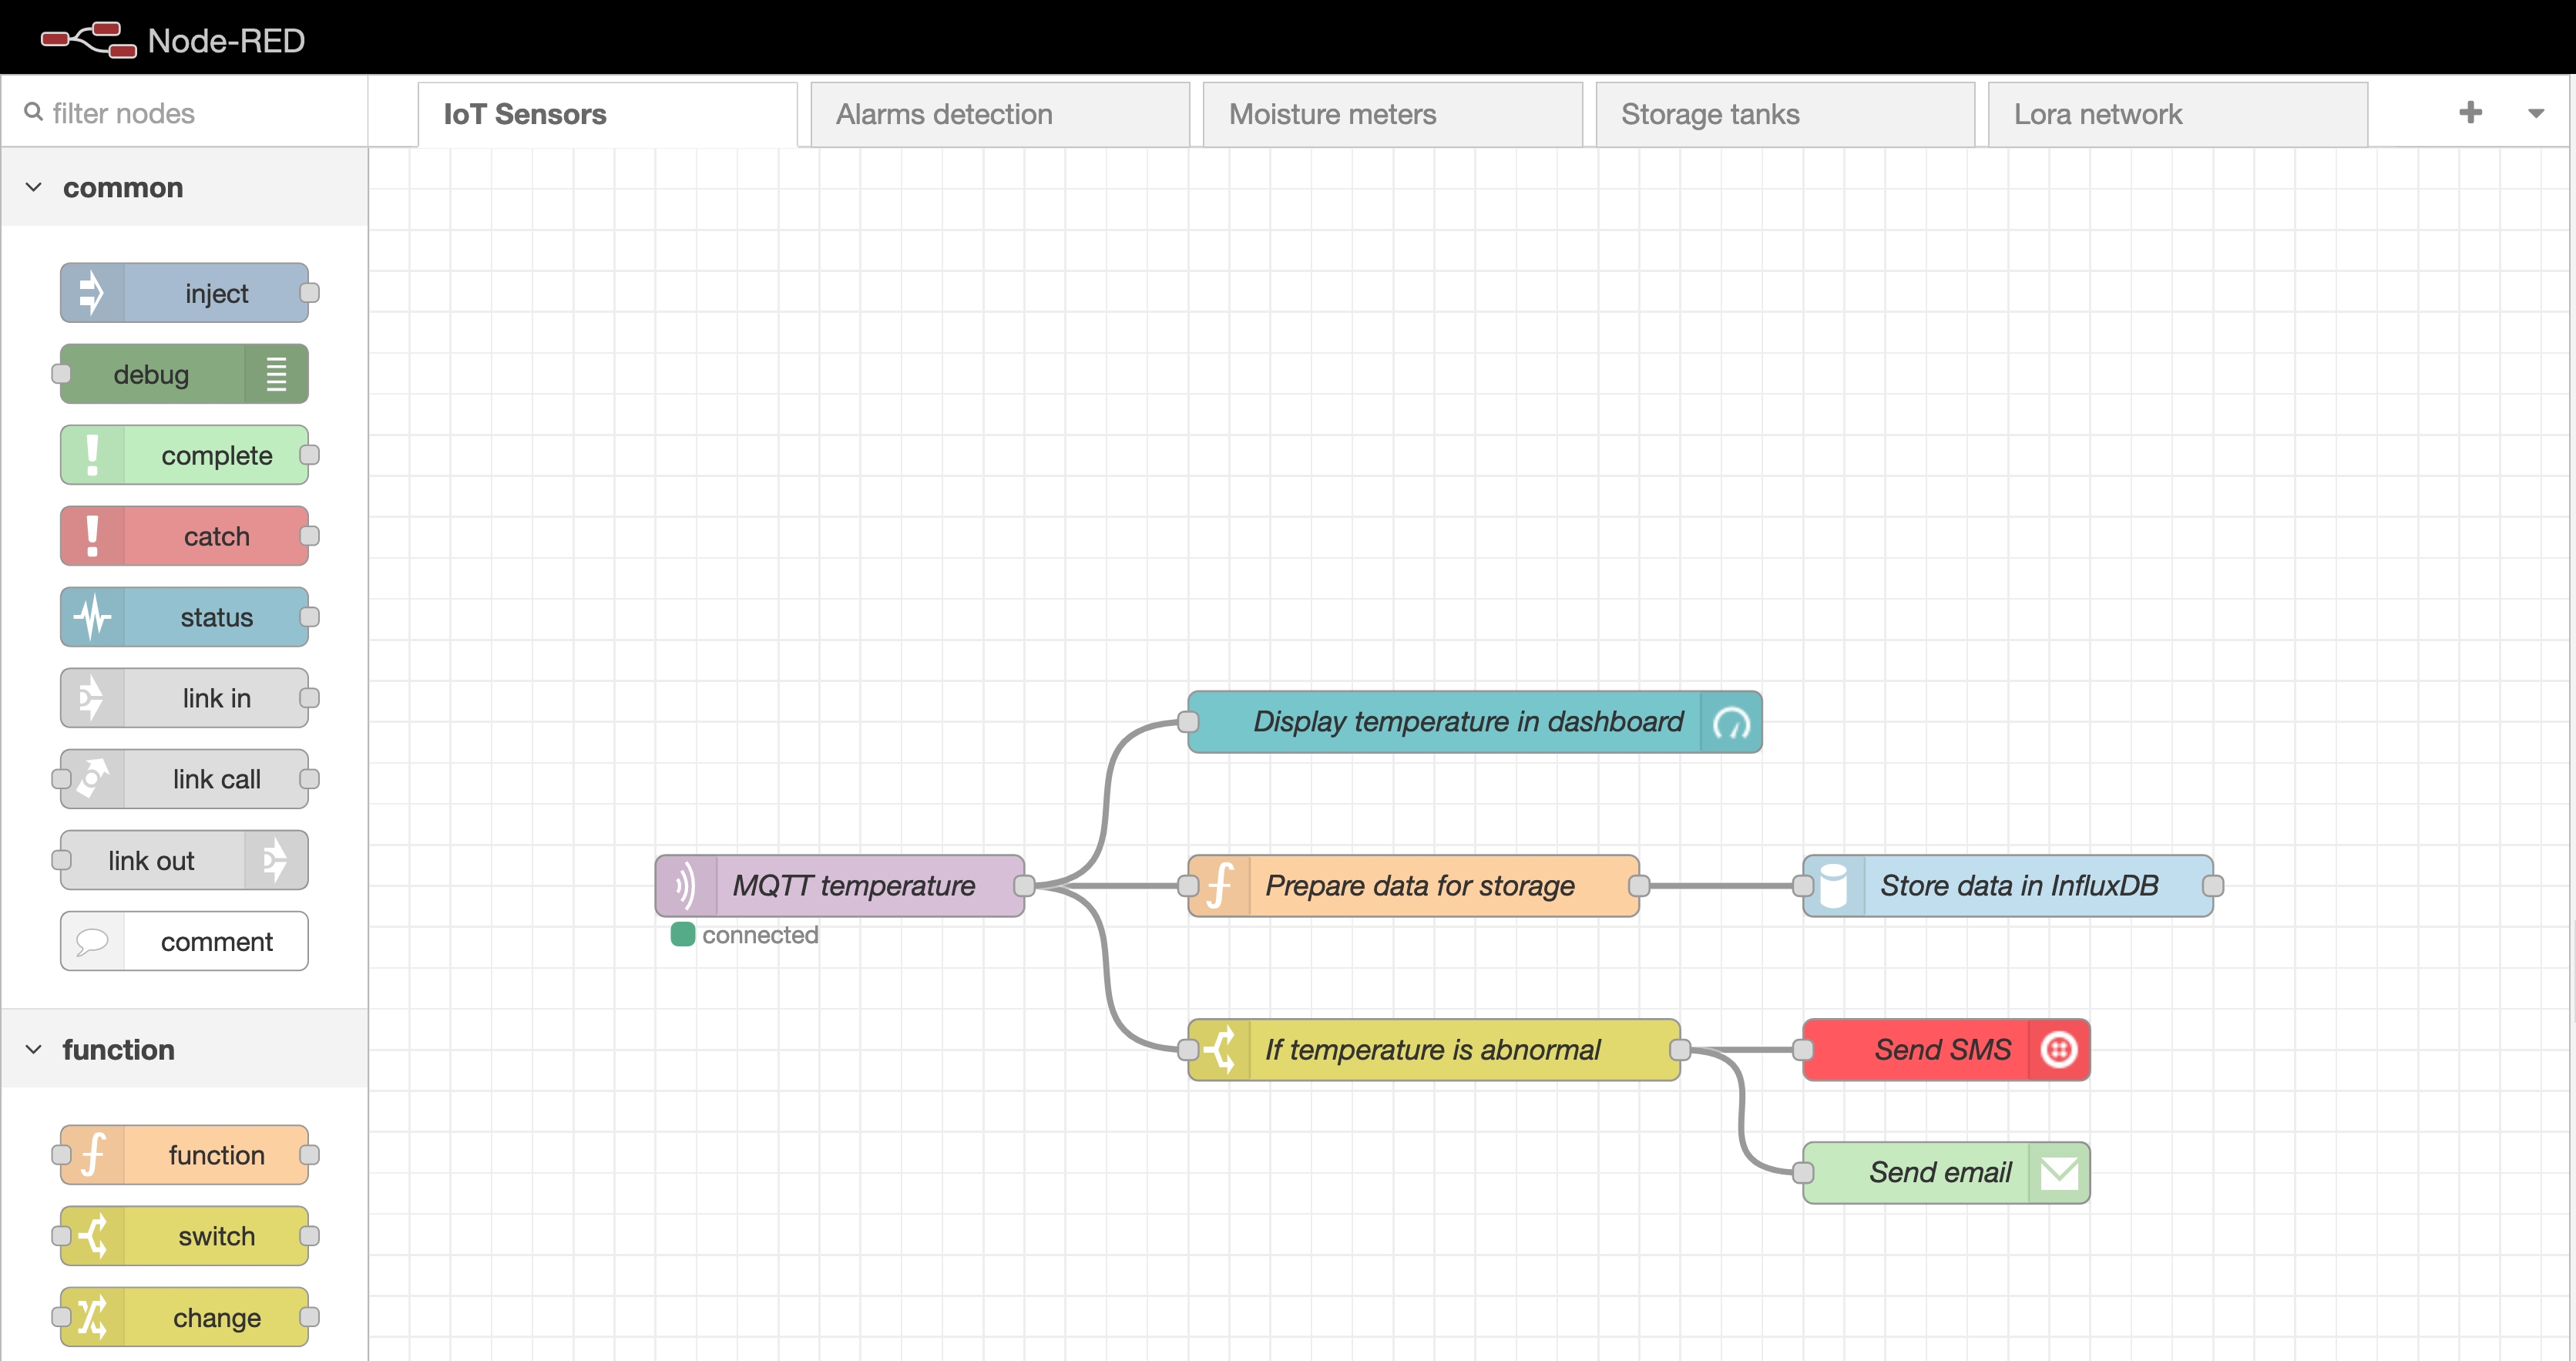
Node-red is another WebApp that acts as the middleware between the broker and the IoT objects. Node-red actually does the heavy lifting by using the TCP protocol and extract/transform/move the data. All the logic is set up in Node-red which is a node.js application using a GUI with code blocks and spaghetti lines.
Figure 4: Example of a node-red spaghetti diagram (Flow)
This is a major improvement versus codelets as node.js is great at dealing with concurrent events and multiple IoT objects. The main advantage is also the large library of code available to communicate via various IoT protocols and it is plain javascript.
In summary, in latest version of the MES, at least 3 WebApps would need to run together (The MES itself, a MQTT broker and Node-red). One could assume that this creates a few point of failures as the data needs to jumps through multiple hoops. It would also require someone competent to maintain the node-red set up (which is maybe not part of anyone's skill set) without mentioning the extra IT resources required to guarantee 100% runtime.
During my time as Cox I suggested 2 alternative options that would eliminate codelets and improve the automation layer as a whole.
Node-red equivalent
In its latest form the MES natively uses the MQTT architecture to interact with IoT objects so a MQTT broker is required. The main idea was to develop a custom node.js server that would replace node-red.
Coding an alternative to node-red in node.js is not as complex as it appears as a lot of libraries are readily available (the same node-red uses). The main advantage is to create a lightweight and high performance application tailored to the automation needs of the factory. Owning the code gives a lot flexibility for future development of the system. Even in its current and latest (in April 2023) form the MES software is not capable of feeding back live data from the machine such as progression or acknowledgment messages, only the end result.
The data flows in this order (Video 1):
A client (The MES) publishes a pset=003 to the 'cox/tooling/123456/command' topic. [PUBLISHING PANE]
When the node.js server starts it subscribes to the topic above and waits for new publication. Once a command is received, the server open a TCP channel with the tool. Once the tool sends the tightening data, the channel is closed and the tightening data is publish to the 'cox/tooling/123456/result' topic. [SERVER PANE]
A client (The MES or any other devices) has already subscribed to the 'cox/tooling/123456/result' and is waiting for new publication. As data is available it can be fetched and shown to the user. [SUBSCRIBING PANE]
Video 1: Data flow between a connected tool, the node-red equivalent and a client
MQTT-less server
One can wonder what is the advantage of MQTT over a web socket server? This is a potential alternative solution that would circumvent the MQTT server and have all data flowing through one node.js server instead.
The MES allowed to embed any local server within the instructions via a iFrame, simply by specifying an URL and custom query parameters. The initial idea was to build a local server in node.js that runs web sockets and the full automation layer in the back end. This would allow a great level of customisation and return all machine communications back to the front end if required. The iFrame's custom URL query parameters would tell the server which IoT object to talk to and what data to serve. The final data could then be stored using the MES public API after all web socket channels have been closed.
In Video 2, the tool is activated by sending an AJAX request to the node.js server which initiates the TCP communication. When a rundown completes all data is sent back to the front end. A command can be sent again by hitting refresh in the browser for that same URL (LIVE MODE PANE). Any other client can subscribe to a open web socket channel and take a peek at the data flow (WATCH MODE PANE).
Video 2: A TCP-enabled web socket server in node.js with data flowing directly to the front end.
In summary, I believe that the automation layer implemented by the third-party was fairly complex and resource intensive (2 extra web servers) and did not really improve the user experience or the data collection process. I believe simpler, more robust and easier to maintained alternatives existed. None of the solutions above went beyond the prototype stage and nor the MQTT + node-red solution been tested at scale. There is no way to conclude if the alternatives presented above would performed significantly better than the third-party's proposed layer. (April 2023)